The homelab gets eyes and a photo album — LGTM and Nextcloud Photos land on the same weekend

Two services, one Saturday 🎸
So in the last post I got Mattermost live at chat.example.com and declared the GitOps recipe proven. The recipe is: HelmRelease + CNPG Postgres + MinIO S3 + dedicated Cloudflare Tunnel. If you can follow that pattern once, you can follow it ten times.
This weekend I followed it twice. On the same day. Because apparently I don’t touch grass on Saturdays 😅
Two things landed:
- The LGTM observability stack — Grafana, Prometheus, Loki, Tempo, and an OpenTelemetry Collector. So the cluster can finally see itself. No more flying blind like on
homelab.one. - Nextcloud Photos at
nextcloud-photos.example.com— a self-hosted Google Photos replacement. Because Google already has enough of my data, thank you very much.
Both follow the same recipe, both are deployed through Flux from the public gulasz101/homelab-2nd repo, and both had their share of “what the hell is happening” moments. Let me walk through each.
Part 1: LGTM — the homelab gets eyes 👀
Why even bother
On homelab.one I ran services without monitoring. It was fine until it wasn’t. When something broke, I was SSH-ing into boxes and reading raw logs like some kind of archaeologist. This time around, the Supreme Leader (that’s me, talking about myself in third person — it’s a whole thing) declared: no new service goes live until it’s observable.
New homelab policy: every service must have logs in Loki, metrics in Prometheus, and — where it makes sense — traces in Tempo. If it’s not in Grafana, it doesn’t exist.
LGTM stands for Loki, Grafana, Tempo, Metrics (Prometheus). Add an OpenTelemetry Collector as the plumbing and you have a full observability stack. Here’s how it fits together:
flowchart TB
    subgraph cluster["k3s homelab-2nd"]
        subgraph apps["Your services"]
            mm[Mattermost]
            nc[Nextcloud]
        end
        otel["OpenTelemetry Collector<br/>(DaemonSet on every node)"]
        prom["Prometheus<br/>+ Alertmanager<br/>+ node-exporter"]
        loki["Loki<br/>(SingleBinary + gateway)"]
        tempo["Tempo<br/>(single-binary)"]
        grafana["Grafana<br/>grafana.example.com"]
    end
    cf["Cloudflare Tunnel"]
    browser["😎 you"]

    apps -->|stdout/stderr logs| otel
    apps -->|OTLP metrics/traces| otel
    otel -->|filelog → OTLP HTTP| loki
    otel -->|remote_write| prom
    otel -->|OTLP gRPC| tempo
    prom -->|scrape /metrics| apps
    grafana -->|datasource| prom
    grafana -->|datasource| loki
    grafana -->|datasource| tempo
    grafana --> cf --> browser
The OpenTelemetry Collector — the plumbing
The Collector runs as a DaemonSet — one pod per node. It reads container logs from /var/log/pods, enriches them with Kubernetes metadata (namespace, pod, container names), and ships them to Loki via the native OTLP HTTP endpoint. It also accepts OTLP metrics and traces from apps and forwards them to Prometheus (remote write) and Tempo.

Here’s the real HelmRelease from the repo, with the pipeline config that wires everything together:
1
2
3
4
5
6
7
8
9
10
11
12
13
14
15
16
17
18
19
20
21
22
23
24
25
26
27
28
29
30
31
32
33
34
35
36
37
38
39
40
41
42
43
44
45
46
47
48
49
50
51
52
53
54
55
56
57
58
59
60
61
62
63
64
65
66
67
68
69
70
# infrastructure/observability/opentelemetry-collector-helm-release.yaml
apiVersion: helm.toolkit.fluxcd.io/v2
kind: HelmRelease
metadata:
  name: opentelemetry-collector
  namespace: observability
spec:
  interval: 1h
  chart:
    spec:
      chart: opentelemetry-collector
      version: ">=0.104.0"
      sourceRef:
        kind: HelmRepository
        name: open-telemetry
        namespace: flux-system
  values:
    mode: daemonset
    image:
      repository: ghcr.io/open-telemetry/opentelemetry-collector-releases/opentelemetry-collector-contrib
    command:
      name: otelcol-contrib

    presets:
      logsCollection:
        enabled: true
        includeCollectorLogs: false
      kubernetesAttributes:
        enabled: true

    config:
      receivers:
        otlp:
          protocols:
            grpc:
              endpoint: ${env:MY_POD_IP}:4317
            http:
              endpoint: ${env:MY_POD_IP}:4318

      exporters:
        # Loki 3.x supports native OTLP log ingestion at /otlp
        otlphttp/loki:
          endpoint: http://loki-gateway.observability.svc.cluster.local:80/otlp
          tls:
            insecure: true
        otlp/tempo:
          endpoint: tempo.observability.svc.cluster.local:4317
          tls:
            insecure: true
        prometheusremotewrite:
          endpoint: http://prometheus-stack-prometheus.observability.svc.cluster.local:9090/api/v1/write
          tls:
            insecure: true
        debug:
          verbosity: basic

      service:
        pipelines:
          logs:
            receivers: [otlp, filelog]
            processors: [batch, k8sattributes]
            exporters: [otlphttp/loki, debug]
          traces:
            receivers: [otlp]
            processors: [batch, k8sattributes]
            exporters: [otlp/tempo, debug]
          metrics:
            receivers: [otlp]
            processors: [batch, k8sattributes]
            exporters: [prometheusremotewrite, debug]
The logsCollection preset already mounts /var/log/pods and /var/lib/docker/containers. Do NOT add them again as extraVolumes — you’ll get a duplicate mount path error and the pod won’t start. I learned this the hard way 🤦
Grafana — the single pane of glass
Grafana runs standalone (not the one bundled with kube-prometheus-stack) so I can provision all three datasources cleanly. The datasources are defined directly in the HelmRelease values:
1
2
3
4
5
6
7
8
9
10
11
12
13
14
15
16
17
18
19
20
21
# infrastructure/observability/grafana-helm-release.yaml (datasources section)
datasources:
  datasources.yaml:
    apiVersion: 1
    datasources:
      - name: Prometheus
        type: prometheus
        url: http://prometheus-stack-kube-prom-prometheus.observability.svc.cluster.local:9090
        access: proxy
        isDefault: true
        editable: false
      - name: Loki
        type: loki
        url: http://loki-gateway.observability.svc.cluster.local:80
        access: proxy
        editable: false
      - name: Tempo
        type: tempo
        url: http://tempo.observability.svc.cluster.local:3200
        access: proxy
        editable: false
Grafana is exposed at https://grafana.example.com through its own dedicated Cloudflare Tunnel — same pattern as Mattermost, one tunnel per service. The tunnel token lives in a SOPS-encrypted secret. No cert-manager, no open router ports.
Problems I hit (aka the useful part)
1. The community Loki chart rendered no Loki pod 😱
First attempt: I used the grafana-community/loki chart in Monolithic mode. The HelmRelease said Ready. But kubectl get pods showed only loki-chunks-cache-0, loki-results-cache-0, and loki-canary-*. No actual Loki container. The chart rendered caches and canary but no StatefulSet for Loki itself.
Fix: added a dedicated HelmRepository pointing at the upstream https://grafana.github.io/helm-charts and switched to deploymentMode: Monolithic with singleBinary.replicas: 1. Deleted the broken release, let Flux recreate it. Loki came up. 🎉
2. Deprecated loki exporter missing from Collector
The OTel Collector complained: 'exporters' unknown type: "loki" for id: "loki". The old loki exporter is deprecated and removed in recent contrib builds.
Fix: use Loki’s native OTLP HTTP endpoint through the gateway — http://loki-gateway.observability.svc.cluster.local:80/otlp. That’s what you see in the HelmRelease above. No more custom exporter, just standard OTLP HTTP.
3. Grafana init-chown-data permission error on a reused PVC
chown: /var/lib/grafana/pdf: Permission denied. The init container tries to chown the data directory, but on a reused PVC the permissions don’t match.
Fix: initChownData.enabled: false. Done.
4. Wrong Prometheus service name in Grafana datasource
Grafana showed “Bad Gateway” for the Prometheus datasource. The service name I had was prometheus-stack-prometheus. The real service is prometheus-stack-kube-prom-prometheus. Classic Helm naming 🙃
Verification — it actually works
After all the fixes, here’s what’s running:
1
2
3
4
5
6
7
8
alertmanager-prometheus-stack-kube-prom-alertmanager-0   2/2 Running
cloudflared-grafana-85f8fd4f79-bvtc5                     1/1 Running
grafana-7bc944d46-fgmcs                                  2/2 Running
loki-0                                                   2/2 Running
loki-gateway-6494447f4b-qxk92                            1/1 Running
opentelemetry-collector-agent-zp4gc                      1/1 Running
prometheus-prometheus-stack-kube-prom-prometheus-0       2/2 Running
tempo-0                                                  1/1 Running
And logs from all namespaces are flowing into Loki:
1
2
curl http://loki-gateway/loki/api/v1/label/k8s_namespace_name/values
# => ["cnpg-system","flux-system","kube-system","mattermost","observability"]
A query for {k8s_namespace_name="mattermost"} returned live CNPG Postgres logs, including WAL archiver warnings. The homelab has eyes now 😎
If you log into Grafana and go to Drilldown → Logs and see “No logs volume available” — don’t panic. The histogram panel just hasn’t loaded yet. The log lines are below it. Or use the classic Explore path: select the Loki datasource, query {k8s_namespace_name="mattermost"}, set time range to Last 1 hour, hit Run query. Logs appear immediately.
Part 2: Nextcloud Photos — escaping Google 📸
The plan
Google Photos has had my pictures since 2014. That’s twelve years of photos living on someone else’s server, subject to someone else’s policy changes. Time to fix that.
The plan: deploy Nextcloud on homelab-2nd, use it as a self-hosted Google Photos replacement, store all user files on MinIO S3 (on the OMV box), back up the Postgres to S3 as well, and expose it at https://nextcloud-photos.example.com through — you guessed it — a dedicated Cloudflare Tunnel.
The hostname is nextcloud-photos.example.com, not just photos.example.com. The Supreme Leader decided photos is too generic — more photo services may come in the future. Naming things is hard.
Storage architecture
This took three iterations to get right. Here’s the final architecture:
flowchart TB
    subgraph k3s["k3s homelab-2nd (NVMe, NOT durable)"]
        nc["Nextcloud pod<br/>/var/www/html (code, config, apps)"]
        pg["CNPG Postgres<br/>nextcloud-db (local-path PVC)"]
        redis["Redis (ephemeral)"]
    end
    subgraph omv["OMV box (durable HDDs)"]
        minio["MinIO S3<br/>bucket: nextcloud-photos<br/>(user file content)"]
        minio2["MinIO S3<br/>bucket: cnpg-backups/nextcloud<br/>(Postgres backups + WAL)"]
    end
    cf["Cloudflare Tunnel"]
    browser["😎 you"]

    nc -->|"S3 primary storage<br/>(all user files)"| minio
    nc --> pg
    nc --> redis
    pg -->|"daily backup + WAL archive"| minio2
    nc --> cf --> browser
The key decision: Nextcloud file content goes to MinIO S3 primary storage, not to local disk. The local NVMe only holds code, config, apps, and thumbnails. If homelab-2nd explodes tomorrow, the photos are still on the OMV box in MinIO.
The HelmRelease — S3 primary storage
Here’s the real HelmRelease, showing the S3 objectStore config that makes Nextcloud stream all uploads to MinIO:
1
2
3
4
5
6
7
8
9
10
11
12
13
14
15
16
17
18
19
20
21
22
23
24
25
26
27
28
29
30
31
32
33
34
35
36
37
38
39
40
41
42
43
44
45
46
47
48
49
50
51
52
53
54
55
56
57
58
59
# apps/nextcloud/nextcloud-helm-release.yaml (key sections)
spec:
  install:
    timeout: 30m    # first install rsyncs ~500MB to the volume
  upgrade:
    timeout: 30m
  values:
    nextcloud:
      host: nextcloud-photos.example.com
      existingSecret:
        enabled: true
        secretName: nextcloud-admin-credentials
        usernameKey: nextcloud-username
        passwordKey: nextcloud-password

      # S3 primary storage on OMV MinIO. The chart translates this into
      # OBJECTSTORE_S3_* env vars, which the Nextcloud entrypoint writes
      # into config.php as objectstore => S3 on first install.
      objectStore:
        s3:
          enabled: true
          existingSecret: nextcloud-minio-creds
          secretKeys:
            accessKey: accessKeyId
            secretKey: secretAccessKey
          host: nas.example.com
          port: 9000
          ssl: false
          usePathStyle: true
          region: us-east-1
          bucket: nextcloud-photos
          autoCreate: false
          legacyAuth: false

    # External Postgres via CNPG
    externalDatabase:
      enabled: true
      type: postgresql
      host: nextcloud-db-rw.nextcloud.svc.cluster.local:5432
      database: nextcloud
      existingSecret:
        enabled: true
        secretName: nextcloud-db-creds

    # Persistence: whole root on NFS PVC, data dir on separate NFS PVC
    persistence:
      enabled: true
      existingClaim: nextcloud-html
      nextcloudData:
        enabled: true
        existingClaim: nextcloud-data

    # PHP tuning for large photo/video uploads
    phpConfigs:
      uploads.ini: |-
        upload_max_filesize=1G
        post_max_size=1G
        max_execution_time=300
        memory_limit=1024M
The database — CNPG with MinIO backups
Same pattern as Mattermost: a CloudNativePG Cluster running on local-path NVMe for speed, with daily backups and WAL archiving to OMV MinIO:
1
2
3
4
5
6
7
8
9
10
11
12
13
14
15
16
17
18
19
20
21
22
23
24
25
26
27
28
29
30
31
32
33
34
35
36
37
38
39
40
41
42
43
# apps/nextcloud/postgres-cluster.yaml
apiVersion: postgresql.cnpg.io/v1
kind: Cluster
metadata:
  name: nextcloud-db
  namespace: nextcloud
spec:
  instances: 1
  imageName: ghcr.io/cloudnative-pg/postgresql:16-minimal-trixie

  postgresql:
    parameters:
      max_connections: "200"
      shared_buffers: "512MB"
      effective_cache_size: "1GB"

  bootstrap:
    initdb:
      database: nextcloud
      owner: nextcloud
      secret:
        name: nextcloud-db-credentials

  # Fast local-path for the live DB — NOT durable, that's what backups are for
  storage:
    storageClass: local-path
    size: 20Gi

  # Backups + WAL archiving to OMV MinIO S3
  backup:
    barmanObjectStore:
      destinationPath: s3://cnpg-backups/nextcloud/
      endpointURL: http://nas.example.com:9000
      s3Credentials:
        accessKeyId:
          name: nextcloud-backup-creds
          key: ACCESS_KEY_ID
        secretAccessKey:
          name: nextcloud-backup-creds
          key: ACCESS_SECRET_KEY
      data:
        compression: gzip
    retentionPolicy: "30d"
And a daily scheduled backup at 3 AM:
1
2
3
4
5
6
7
8
9
10
11
# apps/nextcloud/scheduled-backup.yaml
apiVersion: postgresql.cnpg.io/v1
kind: ScheduledBackup
metadata:
  name: nextcloud-db-daily
  namespace: nextcloud
spec:
  schedule: "0 3 * * *"
  backupOwnerReference: self
  cluster:
    name: nextcloud-db
The persistence rabbit hole 🐇
This is where things got spicy. Three attempts to get Nextcloud persistence right:
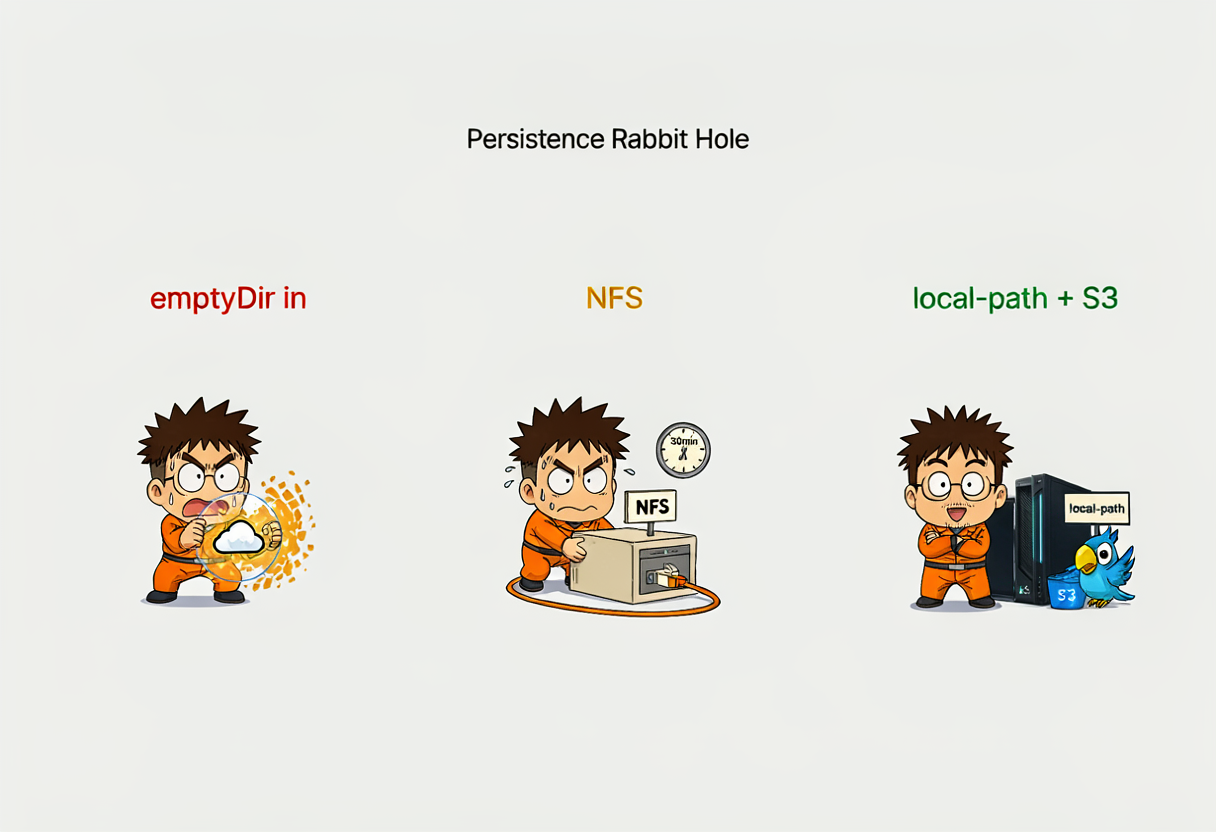
The first deployment used emptyDir for /var/www/html with subpaths for config, data, etc. Problem: every pod restart wiped the install state. config.php didn’t have 'installed' => true. WebDAV returned 302 redirects to the login page. Classic amnesia.
The Nextcloud Helm chart expects extraVolumes/extraVolumeMounts under nextcloud:, NOT at the top level of spec.values. If you put them at the top level, the chart silently ignores them and your pod runs on emptyDir. This is Pitfall 40 in my homelab-gitops skill. I hit it so you don’t have to.
Fix attempt 1: Mount the whole /var/www/html root from an OMV NFS PVC (nextcloud-html, 20 Gi) and /var/www/html/data from a separate NFS PVC (nextcloud-data, 200 Gi). This worked but pod startup was slow — the Nextcloud Docker entrypoint rsyncs ~500 MB of code to the NFS volume on every start. Helm timeout at 10 minutes wasn’t enough.
Fix attempt 2: Bump Helm install/upgrade timeout to 30m. Relax all probes (initialDelaySeconds: 600 on liveness, 300 on readiness, 120 on startup). This worked. Pod takes a while on first start but survives.
Final fix (the one actually deployed now): The Supreme Leader clarified that “no NFS” meant “no NFS for user photo storage”, not “no NFS for Nextcloud runtime state”. So the runtime root went back to local-path PVC (nextcloud-nextcloud, 10 Gi) for fast NVMe, and all user file content goes to MinIO S3 primary storage. Best of both worlds — fast startup, durable photos.
The MinIO key rotation saga
At one point uploads started failing with SignatureDoesNotMatch. The old MinIO key was dead — a new one had to be issued and the SOPS secret updated.

Turns out the MinIO service account key (86YDG...XXXX) no longer existed in MinIO — it had been rotated during earlier debugging and the SOPS secret still had the old key.
Fix: created a dedicated MinIO user nextcloud with a readwrite policy, generated new keys, updated the SOPS-encrypted secret nextcloud-minio-creds.sops.yaml, pushed, let Flux reconcile. Uploads worked again.
Admin password leak — oops 😅
The Nextcloud entrypoint runs occ maintenance:install with the admin password passed as a CLI argument. Which means it’s visible in ps aux inside the pod during install. Not great.
Fix: rotated the admin password via SOPS secret update + occ user:resetpassword --password-from-env with the password fed through stdin so it never touches the command line:
1
2
echo "$NEW_PW" | kubectl -n nextcloud exec -i deployment/nextcloud -c nextcloud -- \
  bash -c 'read -rs PW; export OC_PASS="$PW"; php /var/www/html/occ user:resetpassword --password-from-env admin'
Final verification
Everything green:
1
2
3
4
5
6
7
8
9
10
11
12
Flux kustomizations: Ready
HelmRelease nextcloud: 9.1.3, Ready=True
Pod nextcloud: 2/2 Running
CNPG nextcloud-db-1: healthy
Redis: Running
Cloudflared pods: 2/2 Running
Public URL https://nextcloud-photos.example.com/status.php: HTTP 200
config.php 'installed' flag: true
config.php objectstore: yes
WebDAV PUT/GET/DELETE test: 201 / 200 / 204, content round-trip OK
MinIO bucket nextcloud-photos contains uploaded objects: yes
Loki logs for {k8s_namespace_name="nextcloud"}: entries returned
WebDAV upload round-trip worked, the test object appeared in the MinIO bucket, and deleting it via WebDAV removed it from MinIO. S3 primary storage is real and working.
The repo state after this weekend
Relevant new files in github.com/gulasz101/homelab-2nd:
| Path | What it does |
|---|---|
infrastructure/observability/prometheus-stack-helm-release.yaml | kube-prometheus-stack (Grafana disabled) |
infrastructure/observability/loki-helm-release.yaml | Loki SingleBinary + gateway, S3 on MinIO |
infrastructure/observability/tempo-helm-release.yaml | Tempo single-binary, local-path storage |
infrastructure/observability/grafana-helm-release.yaml | Standalone Grafana with LGTM datasources |
infrastructure/observability/opentelemetry-collector-helm-release.yaml | OTel Collector DaemonSet |
infrastructure/observability/cloudflared-grafana-deployment.yaml | Cloudflare Tunnel for grafana.example.com |
infrastructure/observability/grafana-admin-credentials.sops.yaml | SOPS-encrypted Grafana admin password |
infrastructure/observability/grafana-tunnel-token.sops.yaml | SOPS-encrypted Cloudflare tunnel token |
apps/nextcloud/nextcloud-helm-release.yaml | Nextcloud with S3 primary storage |
apps/nextcloud/postgres-cluster.yaml | CNPG Postgres + MinIO backups |
apps/nextcloud/scheduled-backup.yaml | Daily 3 AM backup schedule |
apps/nextcloud/nextcloud-minio-creds.sops.yaml | SOPS-encrypted MinIO credentials |
apps/nextcloud/nextcloud-cloudflare-token.sops.yaml | SOPS-encrypted Cloudflare tunnel token |
apps/nextcloud/cloudflared-deployment.yaml | Cloudflare Tunnel for nextcloud-photos.example.com |
All secrets are SOPS-encrypted with age. The repo is public. Zero plaintext credentials. That’s the whole point.
What’s running now
flowchart LR
    subgraph done["✅ Live"]
        mm["Mattermost<br/>chat.example.com"]
        graf["Grafana<br/>grafana.example.com"]
        nc["Nextcloud Photos<br/>nextcloud-photos.example.com"]
    end
    subgraph observability["Observability (internal)"]
        prom["Prometheus"]
        loki["Loki"]
        tempo["Tempo"]
        otel["OTel Collector"]
    end
    recipe["GitOps recipe:<br/>HelmRelease + CNPG +<br/>MinIO S3 + Cloudflare Tunnel"]
    recipe --> mm
    recipe --> nc
    recipe --> graf
    mm -.->|scraped by| prom
    nc -.->|scraped by| prom
    mm -.->|logs to| loki
    nc -.->|logs to| loki
Three public services, all behind Cloudflare Tunnels, all observable in Grafana. Not bad for a weekend 😎
Lessons learned (the condensed version)
Read the chart’s values.yaml before fighting it. The
extraVolumesplacement issue, thelokiexporter deprecation, the service name mismatch — all would’ve been 5-minute fixes instead of 30-minute debugging sessions if I’d read the actual chart defaults first.emptyDiris not persistence. It’s a RAM disk that dies on pod restart. If your app stores install state, it needs a real PVC. Shocking, I know.SOPS secrets with wrong keys = silent failure. The MinIO key rotation broke uploads silently. Flux happily reconciled a secret with a stale key. Always verify the actual credentials, not just that the secret exists.
Admin passwords in CLI args are visible in
ps aux. Rotate them. Feed the new one through stdin.One Cloudflare Tunnel per service is the way. Grafana, Mattermost, Nextcloud — each has its own tunnel. If one tunnel breaks, the others stay up. Isolation is worth the extra setup.
Every service must be observable. If it’s not in Grafana, it doesn’t exist. This is now policy, not just a good idea.
What’s next
The observability stack needs real dashboards — I have the system-load and GPU power dashboards committed, but there’s room for a proper cluster health overview. And Nextcloud still needs the Memories app for the actual Google-Photos-like experience (map view, timeline, face recognition). That’s a follow-up.
After that: the LLM hub. LiteLLM + OpenWebUI. Because what’s a homelab without a local LLM setup that nobody uses? 😅
Repo is here if you want to follow along: github.com/gulasz101/homelab-2nd
Cheers! 🎸