OpenTelemetry with UV and odoo
After working for last 18 months with odoo WMS team. Reading tons of tutorials how to get odoo setup done. Below is summary of what I’m finding as very interesting setup for local development, and who knows, maybe at some point being a production candidate. I will definitely give it a try on lower environments.
Content
- components overview
- instrumenting odoo
- setting up LGTM stack with docker compose
- setup up odoo project with uv
- starting project
Assumptions
- I will use odoo version 18.
- I do not need to upgrade my system super frequently, that is why I’m building lock file the way I do with uv.
- I wanted to get started with opentelemetry instrumentation at some point.
- I wanted to have better understanding how to combine LGTM containers together.
- I’m not python dev.
Components for this setup
Tooling
- uv - dependency and project manager which makes entire experience of working with python and odoo extremely pleasant.
- docker - easiest way to have all the dependencies running with no time without having to install them on host.
- lazyvim - any editor will work, I’m just used to nvim, and lazyvim set of configs is kind of sweet spot that does not make me to change anything.
Components of setup
- odoo source code
- postgreSQL - database that odoo uses
- LGTM stack
- grafana/loki - distributed backend for Logs
- Grafana - visualize everything
- grafana/tempo - Tracing backend
- prometheus - for Metrics
- opentelemetry collector - to proxy all your telemetry data to respective backends
Everything above is assembled to single docker compose file. Sourced from the official docs and LGTM stack example
Odoo instrumentation
Sadly there is no autoinstrumentation for odoo. ☹️
However there is help!
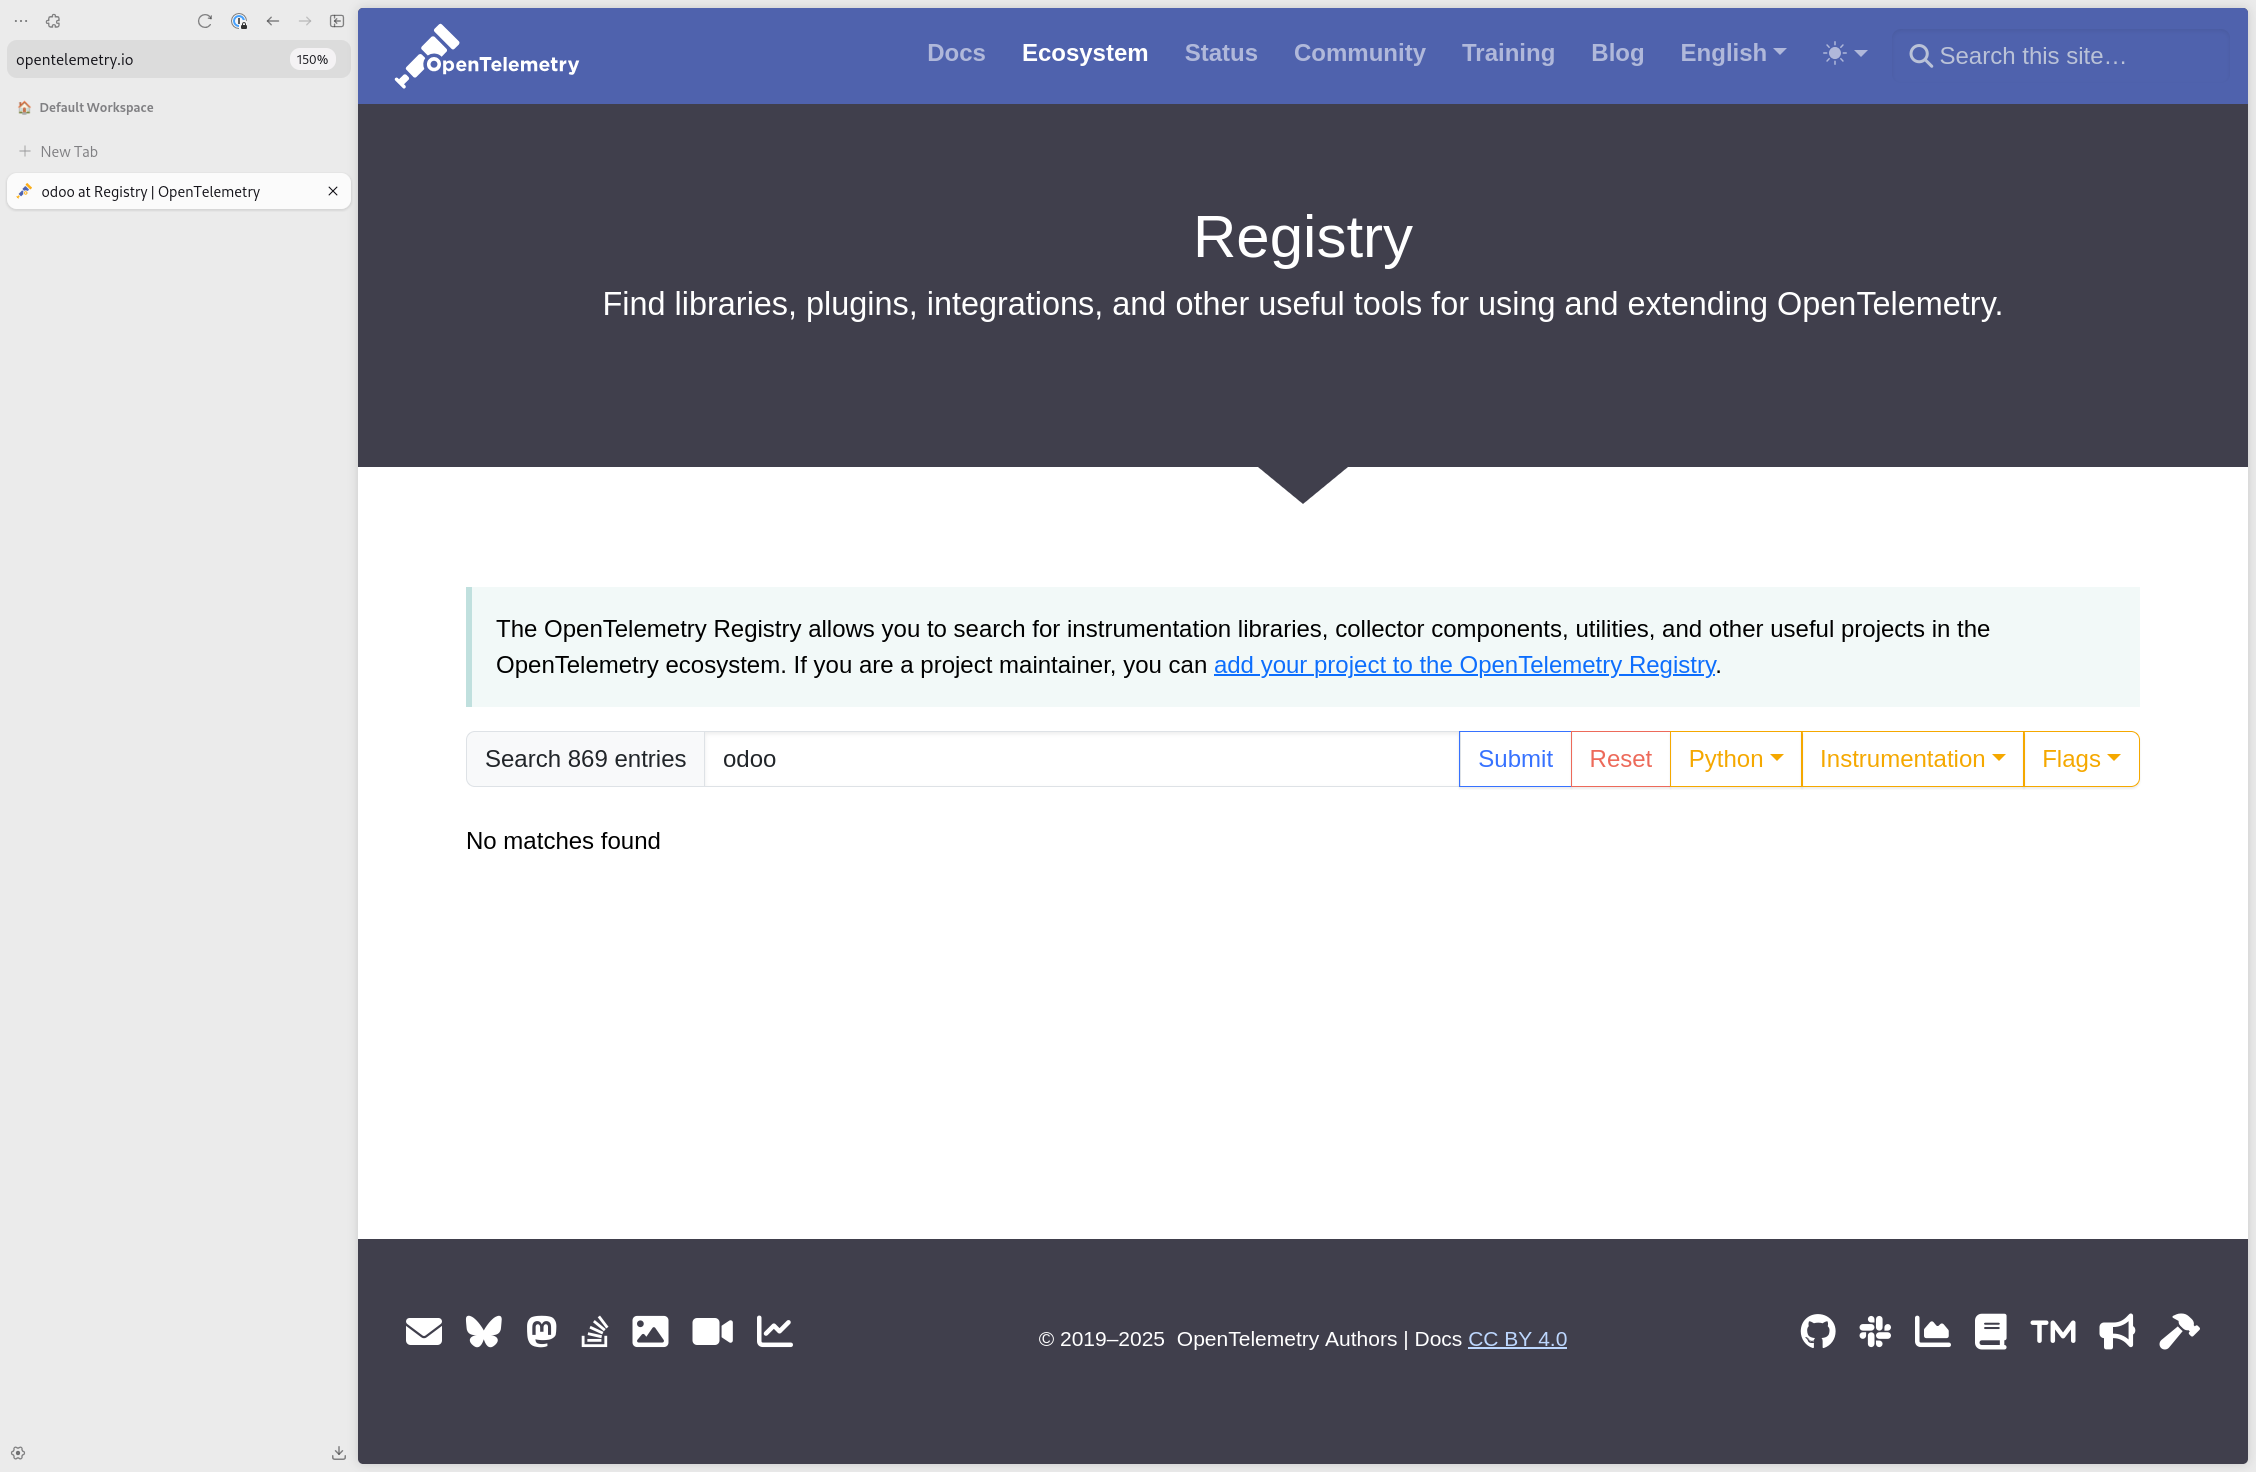
wsgi
Since odoo to certain degree implements Web Server Gateway Protocol we can use OpenTelemetryMiddleware.
So just to get proof of concept without going too deep. Let’s copy and edit odoo-bin file 😎
1
2
3
4
5
6
7
8
9
10
11
12
13
14
15
16
17
18
19
20
21
22
23
24
25
26
27
28
29
30
31
32
33
34
35
36
37
38
39
40
41
42
43
44
45
46
47
48
49
50
51
52
53
54
55
56
57
58
#!/usr/bin/env python3

# set server timezone in UTC before time module imported
__import__("os").environ["TZ"] = "UTC"
import odoo
from odoo.service import server

from opentelemetry import trace
from opentelemetry.instrumentation.wsgi import OpenTelemetryMiddleware
from opentelemetry.instrumentation.psycopg2 import Psycopg2Instrumentor


class OdooOpenTelemetryMiddleware(OpenTelemetryMiddleware):
    """Custom middleware to wrap Odoo's application and preserve Odoo methods."""

    def __call__(self, environ, start_response):
        """Wrap the WSGI application and add the trace ID to the response headers."""

        def start_response_with_trace_id(status, response_headers, exc_info=None):
            span = trace.get_current_span()
            if span.is_recording():
                span_context = span.get_span_context()
                if span_context.trace_id != trace.INVALID_TRACE_ID:
                    trace_id = trace_id_to_hex(span_context.trace_id)
                    response_headers.append(("X-Trace-Id", trace_id))

            return start_response(status, response_headers, exc_info)

        return super().__call__(environ, start_response_with_trace_id)

    def __getattr__(self, name):
        """Forward calls to the original WSGI if not found in the middleware."""
        if hasattr(self.wsgi, name):
            return getattr(self.wsgi, name)
        raise AttributeError(
            f"'{type(self).__name__}' object has no attribute '{name}'"
        )


def trace_id_to_hex(trace_id):
    """Convert a trace ID to a hexadecimal string."""
    return f"{trace_id:032x}"


def create_instrumented_wsgi_app(odoo_app):
    Psycopg2Instrumentor().instrument()
    wrapped_app = OdooOpenTelemetryMiddleware(odoo_app)
    return wrapped_app


if __name__ == "__main__":
    import odoo.http

    original_app = odoo.http.root
    odoo.http.root = create_instrumented_wsgi_app(original_app)

    Psycopg2Instrumentor().instrument()
    odoo.cli.main()
What has happened here?
- Every response is adding extra
X-Trace-Idheader, so we have nicer traceability while we are performing http requests. - We have also instrumented
psycopg2withPsycopg2Instrumentor().instrument()to be sure, all database interactions will be reflected as spans under our trace.
But how to collect those traces?
Zero code opentelemetry instrumentation. click for more details
We need to setup out project with otel distro.
Just execute:
1
uv add opentelemetry-distro opentelemetry-exporter-otlp
What happened above? We added entire zero code instrumentation dependencies to our project. Plus explicitly installed exporter so we can send our observability signals over grpc using otel protocol.
Since I’m not a python dev and honestly I also not put much effort in understanding this, for me following this part of official otel docs never really worked.
Let’s try it out
Since we are using (almost) zero code instrumentation, we can configure a lot just with environment variables.
Since logging for python is still beta, we need to explicitly enable it
OTEL_PYTHON_LOGGING_AUTO_INSTRUMENTATION_ENABLED=true
POSTGRES_USER=app
POSTGRES_PASSWORD=app
POSTGRES_DB=app

OTEL_SERVICE_NAME="odoo-uv"
# OTEL_TRACES_EXPORTER=otlpp
OTEL_TRACES_EXPORTER=console
# OTEL_METRICS_EXPORTER=otlp
OTEL_METRICS_EXPORTER=console
# OTEL_LOGS_EXPORTER=otlp
OTEL_LOGS_EXPORTER=console

OTEL_PYTHON_LOGGING_AUTO_INSTRUMENTATION_ENABLED=true
OTEL_PYTHON_LOG_FORMAT="%(msg)s [span_id=%(span_id)s]"
OTEL_PYTHON_LOG_LEVEL=debug
OTEL_PYTHON_LOG_CORRELATION=true

OTEL_EXPORTER_OTLP_ENDPOINT=http://0.0.0.0:4317
Now only we need to execute:
1
2
3
4
5
6
7
8
9
10
11
12
13
14
15
16
17
18
19
uv run \
 --env-file .env \
    -- \
    opentelemetry-instrument \
    python odoo-bin \
    --init=base,sale,stock \
    --load=base,sale,stock \
    --data-dir=./odoo-data \
    --addons-path=./odoo/addons \
    --database="$POSTGRES_DB" \
    --db_user="$POSTGRES_USER" \
    --db_password="$POSTGRES_PASSWORD" \
    --db_host=0.0.0.0 \
    --db_port=5432 \
    --db_sslmode=disable \
    --db_maxconn=10 \
    --max-cron-threads=1 \
    --workers=0 \
    --syslog
(If something does not work here, go to the bottom for more detailed instruction).
Expected output:
1
2
3
4
5
6
7
8
9
10
11
12
13
14
15
16
17
18
19
20
21
22
23
24
25
26
27
28
29
30
31
32
33
34
35
36
37
38
39
40
41
---
 "events": [],
    "links": [],
    "resource": {
        "attributes": {
            "telemetry.sdk.language": "python",
            "telemetry.sdk.name": "opentelemetry",
            "telemetry.sdk.version": "1.31.1",
            "service.name": "odoo-uv",
            "telemetry.auto.version": "0.52b1"
        },
        "schema_url": ""
    }
}
{
    "name": "WITH",
    "context": {
        "trace_id": "0xa88155a470fdcef60138777a9e3da9dd",
        "span_id": "0x5d0127c4dc4c0640",
        "trace_state": "[]"
    },
    "kind": "SpanKind.CLIENT",
    "parent_id": null,
    "start_time": "2025-04-10T06:27:41.293545Z",
    "end_time": "2025-04-10T06:27:41.294304Z",
    "status": {
        "status_code": "UNSET"
    },
    "attributes": {
        "db.system": "postgresql",
        "db.name": "app",
        "db.statement": "\n            WITH RECURSIVE ir_ui_view_inherits AS (\n                SELECT id, inherit_id, priority, mode, model\n                FROM ir_ui_view\n                WHERE id IN %s AND ((\"ir_ui_view\".\"active\" = TRUE))\n            UNION\n                SELECT ir_ui_view.id, ir_ui_view.inherit_id, ir_ui_view.priority,\n                       ir_ui_view.mode, ir_ui_view.model\n                FROM ir_ui_view\n                INNER JOIN ir_ui_view_inherits parent ON parent.id = ir_ui_view.inherit_id\n                WHERE coalesce(ir_ui_view.model, '') = coalesce(parent.model, '')\n                      AND ir_ui_view.mode = 'extension'\n                      AND ((\"ir_ui_view\".\"active\" = TRUE))\n            )\n            SELECT\n                v.id, v.inherit_id, v.mode\n            FROM ir_ui_view_inherits v\n            ORDER BY v.priority, v.id\n        ",
        "db.user": "app",
        "net.peer.name": "0.0.0.0",
        "net.peer.port": 5432
    },
    "events": [],
    "links": [],
    "resource": {
        "attributes": {
---
All above are observability signals that we are sending to CLI stdout. But this is not the point. What we want is to have convenient way of visualizing all our observability signals:
- metrics
- traces
- logs
To achieve that we need to setup LGTM stack.
LGTM stack with docker compose
To be fair, easiest way to start with LGTM stack is just to follow
However I like to more or less understand what I’m doing.
Loki - for logs
config
1
2
3
4
5
6
7
8
9
10
11
12
13
14
15
16
17
18
19
20
21
22
23
24
25
26
27
28
29
30
31
---
configs:
  loki-config:
    content: |
      ---
      auth_enabled: false
      server:
        http_listen_port: 3100
      common:
        path_prefix: /data/loki
        storage:
          filesystem:
            chunks_directory: /data/loki/chunks
            rules_directory: /data/loki/rules
        replication_factor: 1
        ring:
          kvstore:
            store: inmemory
      schema_config:
        configs:
          - from: 2020-10-24
            store: tsdb
            object_store: filesystem
            schema: v13
            index:
              prefix: index_
              period: 24h
      ruler:
        alertmanager_url: http://prometheus:9093
This is not production ready config. Just something to have proof of concept. Mostly copy pasted from https://github.com/grafana/docker-otel-lgtm/blob/main/docker/loki-config.yaml
volume
1
2
3
---
volumes:
 data-loki:
I want to persist logs, so between debugging sessions my logs are not getting erased and I have later more volume when we will have to start visualizing data.
service
1
2
3
4
5
6
7
8
9
---
services:
  loki:
    image: grafana/loki:${LOKI_VERSION}
    configs:
    - source: loki-config
      target: /etc/loki.yaml
    volumes:
    - data-loki:/loki
grafana - web interface to signals
config
1
2
3
4
5
6
7
8
9
10
11
12
13
14
15
16
17
18
19
20
21
22
23
24
25
26
27
28
29
30
31
32
33
34
35
36
37
38
39
40
41
42
43
44
45
46
47
48
49
50
# ./grafana-datasources.yaml
---
apiVersion: 1

datasources:
- name: Prometheus
  type: prometheus
  uid: prometheus
  url: http://prometheus:9090
  jsonData:
    timeInterval: 60s
    exemplarTraceIdDestinations:
      - name: trace_id
        datasourceUid: tempo
        urlDisplayLabel: "Trace: $${__value.raw}"

- name: Tempo
  type: tempo
  uid: tempo
  url: http://tempo:3200
  jsonData:
    tracesToLogsV2:
      customQuery: true
      datasourceUid: "loki"
      # https://github.com/grafana/grafana/issues/64659#issuecomment-1471877100
      tags: [ {key: 'service.name', value: 'service_name'} ]
      query: '{$${__tags}}'
      # query: '{trace_id="$${__span.traceId}"}'

    serviceMap:
      datasourceUid: "prometheus"
    search:
      hide: false
    nodeGraph:
      enabled: true
    lokiSearch:
      datasourceUid: "loki"

- name: Loki
  type: loki
  uid: loki
  url: http://loki:3100
  jsonData:
    derivedFields:
      - name: "trace_id"
        matcherType: "label"
        matcherRegex: "trace_id"
        url: "$${__value.raw}"
        datasourceUid: "tempo"
        urlDisplayLabel: "Trace: $${__value.raw}"
Datasources file is mounted as a volume because parsing of configs in docker compose breaks the config content as there are $ signs there.
tracesToLogsV2
1
2
3
4
5
    tracesToLogsV2:
      customQuery: true
      datasourceUid: "loki"
      tags: [ {key: 'service.name', value: 'service_name'} ]
      query: '{$${__tags}}'
This is very important part. We are instrumenting grafana to enable us small “logs icon” which will allow us to search through all the logs correlated to specific trace.
loki derived fields
1
2
3
4
5
6
7
8
9
    derivedFields:
 # Field with internal link pointing to data source in Grafana.
    # datasourceUid value can be anything, but it should be unique across all defined data source uids.
      - name: "trace_id"
        matcherType: "label"
        matcherRegex: "trace_id"
        url: "$${__value.raw}"
        datasourceUid: "tempo"
        urlDisplayLabel: "Trace: $${__value.raw}"
service
1
2
3
4
5
6
7
8
9
10
11
12
13
---
services:
  grafana:
    image: grafana/grafana:${GRAFANA_VERSION}
    volumes:
    - ./grafana-datasources.yaml:/etc/grafana/provisioning/datasources/datasources.yaml
    environment:
      - GF_AUTH_ANONYMOUS_ENABLED=true
      - GF_AUTH_ANONYMOUS_ORG_ROLE=Admin
      - GF_AUTH_DISABLE_LOGIN_FORM=true
      - GF_FEATURE_TOGGLES_ENABLE=traceqlEditor
    ports:
      - "3000:3000"
Tempo - for traces
config
1
2
3
4
5
6
7
8
9
10
11
12
13
14
15
16
17
18
19
20
21
22
23
24
25
26
27
28
29
30
31
32
33
34
35
36
37
38
39
40
---
configs:
  tempo-config:
    content: |
      ---
      server:
        http_listen_port: 3200
      distributor:
        receivers:
          otlp:
            protocols:
              grpc:
                endpoint: "0.0.0.0:4317"
              http:
                endpoint: "0.0.0.0:4318"
      storage:
        trace:
          backend: local
          wal:
            path: /data/tempo/wal
          local:
            path: /data/tempo/blocks
      metrics_generator:
        processor:
          local_blocks:
            filter_server_spans: false
          span_metrics:
            dimensions:
              - service_name
              - operation
              - status_code
        traces_storage:
          path: /data/tempo/generator/traces
        storage:
          path: /data/tempo/generator/wal
          remote_write:
            - url: http://prometheus:9090/api/v1/write
              send_exemplars: true
      overrides:
        metrics_generator_processors: [service-graphs, local-blocks, span-metrics]
Most interesting thing is: metrics generator
Also setting up receiver to accept otlp signals over http and grpc.
volume
1
2
3
---
volumes:
  data-tempo:
service
1
2
3
4
5
6
7
8
9
10
11
12
13
14
15
16
17
18
19
20
21
22
23
24
25
26
27
28
29
---
services:

  tempo-init:
    image: &tempoImage grafana/tempo:${TEMPO_VERSION}
    user: root
    entrypoint:
      - "chown"
      - "-R"
      - "10001:10001"
      - "/data"
    volumes:
      - data-tempo:/data

  tempo:
    image: *tempoImage
    # image: grafana/tempo:latest
    depends_on:
      - tempo-init
    command: [ "-config.file=/etc/tempo.yaml" ]
    configs:
    - source: tempo-config
      target: /etc/tempo.yaml
      uid: "10001"
      gid: "10001"
      mode: "0644"
    volumes:
      - data-tempo:/data:rw
By default tempo image is using user 10001, that is why there is tempo-init service setup giving permissions to /data directory to that user.
prometheus for metrics
config
1
2
3
4
5
6
7
8
9
10
11
12
13
14
15
16
17
18
19
20
---
configs:
  prometheus-config:
    content: |
      ---
      # https://github.com/grafana/docker-otel-lgtm/blob/main/docker/prometheus.yaml
      otlp:
        keep_identifying_resource_attributes: true
        # Recommended attributes to be promoted to labels.
        promote_resource_attributes:
          - service.instance.id
          - service.name
          - service.namespace
          - service.version
      storage:
        tsdb:
          # A 10min time window is enough because it can easily absorb retries and network delays.
          out_of_order_time_window: 10m
Basic prometheus config.
service
1
2
3
4
5
6
7
8
9
10
11
12
13
14
15
16
17
18
---
services:
   prometheus:
    # image: prom/prometheus:latest
    # https://github.com/open-telemetry/opentelemetry-demo/blob/main/.env#L21C1-L21C54
    image: quay.io/prometheus/prometheus:${PROMETHEUS_VERSION}
    command:
      # https://prometheus.io/docs/guides/opentelemetry/#enable-the-otlp-receiver
      # https://stackoverflow.com/a/79136674
      - --web.enable-otlp-receiver
      # - --enable-feature=otlp-write-receiver
    configs:
    - source: prometheus-config
      target: /prometheus/prometheus.yml
      uid: "10001"
      gid: "10001"
      mode: "0644"
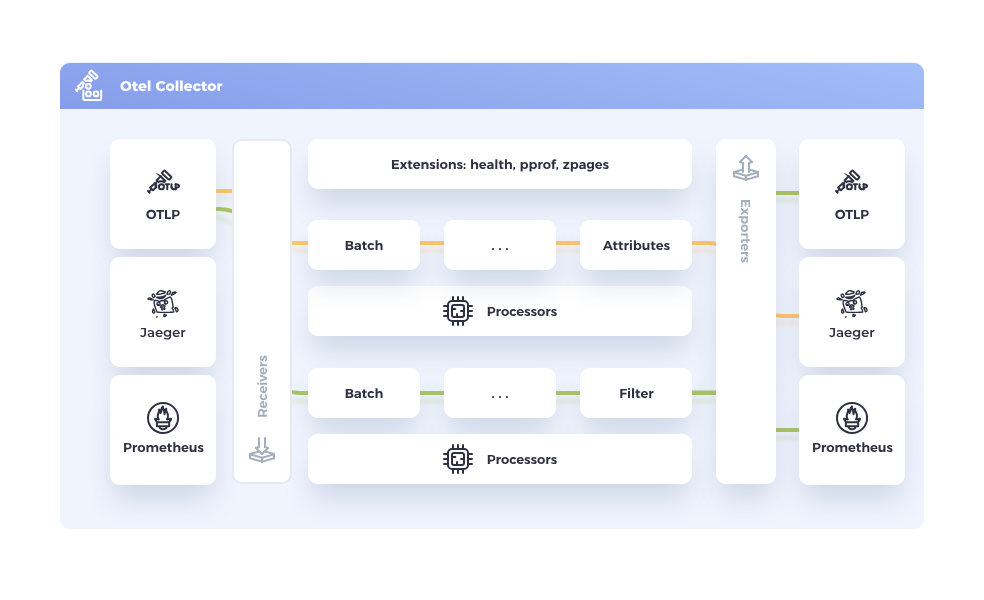
collector
Once there are all the backends setup, would be a pity making application aware about all those backennds. For keeping configuration clean, better practice is to setup single point for collecting and distributing all the signals.
config
1
2
3
4
5
6
7
8
9
10
11
12
13
14
15
16
17
18
19
20
21
22
23
24
25
26
27
28
29
30
31
32
33
34
35
36
37
38
39
40
41
42
43
44
45
46
47
48
49
50
51
52
53
54
55
56
57
58
---
configs:
  otelcol-config:
    content: |
      ---
      # https://github.com/grafana/docker-otel-lgtm/blob/main/docker/otelcol-config.yaml
      receivers:
        otlp:
          protocols:
            grpc:
              endpoint: 0.0.0.0:4317
            http:
              endpoint: 0.0.0.0:4318
        prometheus/collector:
          config:
            scrape_configs:
              - job_name: "opentelemetry-collector"
                static_configs:
                  - targets: ["localhost:8888"]
      processors:
        batch:
      exporters:
        otlphttp/metrics:
          endpoint: http://prometheus:9090/api/v1/otlp
          tls:
            insecure: true
        otlphttp/traces:
          endpoint: http://tempo:4318
          tls:
            insecure: true
        otlphttp/logs:
          endpoint: http://loki:3100/otlp
          tls:
            insecure: true
        debug/metrics:
          verbosity: detailed
        debug/traces:
          verbosity: detailed
        debug/logs:
          verbosity: detailed
      service:
        pipelines:
          traces:
            receivers: [otlp]
            processors: [batch]
            exporters: [otlphttp/traces]
            # exporters: [otlphttp/traces,debug/traces]
          metrics:
            receivers: [otlp]
            processors: [batch]
            exporters: [otlphttp/metrics]
            # exporters: [otlphttp/metrics,debug/metrics]
          logs:
            receivers: [otlp]
            processors: [batch]
            exporters: [otlphttp/logs]
            # exporters: [debug/logs]
More info about above configuration https://opentelemetry.io/docs/collector/configuration/
service
1
2
3
4
5
6
7
8
9
10
11
12
13
14
---
services:
  otelcol:
    image:  otel/opentelemetry-collector-contrib:${OPENTELEMETRY_COLLECTOR_VERSION}
    command: ["--config=/etc/otel-collector-config.yml"]
    configs:
    - source: otelcol-config
      target: /etc/otel-collector-config.yml
      uid: "1001"
      gid: "1001"
      mode: "0644"
    ports:
      - "4317:4317"
      - "4318:4318"
setup project with uv
Now once we have all the components. Let’s setup working example.
git and odoo
1
2
3
4
5
6

mkdir odoo-uv && cd odoo-uv

git init

git submodule add -b 18.0 --depth 1 https://github.com/odoo/odoo.git odoo
edit the .gitmodules , add shallow = true at the end of the file:
1
2
3
4
5
[submodule "odoo"]
 path = odoo
 url = https://github.com/odoo/odoo.git
 branch = 18.0
 shallow = true
And run:
1
git submodule update --init --recursive
uv setup
1
2
3
4
5
6
7
uv init

# this will fetch and lock all the odoo dependencies for us
uv add -r odoo/requirements.txt

# as this was python version I was using while setting up everything
uv python pin 3.12
system dependencies
I was setting up everything on fedora, so depends on os packages names might vary. Here is what I needed to do on my. mac os only required potgresql (but I might had installed some other dependencies in past… for using treesitter etc…).
1
2
3
4
5
6
7
8
9
10
11
12
13
14
15
16
# psql
sudo dnf install postgresql-server postgresql-contrib

# python-ldap
sudo dnf install openldap-devel

# pg_config
sudo dnf install postgresql-server-devel
# macos
# brew install postgresql

# greenlet
sudo dnf install python3-greenlet-devel

# psycopg2
sudo dnf install clang
add otel dependencies
1
2
3
4
uv add \
 opentelemetry-distro \
 opentelemetry-exporter-otlp \
 opentelemetry-instrumentation-wsgi
project structure
At the end project structure should look like following:
1
2
3
4
5
6
7
8
9
10
11
12
13
14
15
16
17
18
19
20
21
22
23
24
25
26
27
28
29
30
31
32
33
34
35
36
37
38
39
40
41
42
43
44
45
46
47
48
49
50
51
52
53
54
55
56
57
58
59
60
61
62
.
├── docker-compose.yaml
├── .env
├── .git
│   ├── config
│   ├── description
│   ├── HEAD
│   ├── hooks
│   ├── index
│   ├── info
│   ├── modules
│   ├── objects
│   └── refs
├── .gitignore
├── .gitmodules
├── grafana-datasources.yaml
├── odoo
│   ├── addons
│   ├── build
│   ├── CONTRIBUTING.md
│   ├── COPYRIGHT
│   ├── debian
│   ├── doc
│   ├── .git
│   ├── .github
│   ├── .gitignore
│   ├── LICENSE
│   ├── MANIFEST.in
│   ├── odoo
│   ├── odoo-bin
│   ├── odoo.egg-info
│   ├── README.md
│   ├── requirements.txt
│   ├── SECURITY.md
│   ├── setup
│   ├── setup.cfg
│   ├── setup.py
│   └── .tx
├── odoo-bin
├── odoo-data
│   ├── addons
│   ├── filestore
│   └── sessions
├── __pycache__
│   └── logging.cpython-312.pyc
├── pyproject.toml
├── .python-version
├── README.md
├── uv.lock
└── .venv
    ├── bin
    ├── CACHEDIR.TAG
    ├── .gitignore
    ├── include
    ├── lib
    ├── lib64 -> lib
    ├── .lock
    ├── pyvenv.cfg
    └── share

28 directories, 31 files
postgres
volume
1
2
3
---
volumes:
  data-postgres:
service
1
2
3
4
5
6
7
8
9
---
services:
  postgres:
    image: postgres:14-alpine
    ports:
      - 5432:5432
    volumes:
      - data-postgres:/var/lib/postgresql/data
    env_file: .env
environment
GRAFANA_VERSION=11.6.0
PROMETHEUS_VERSION=v3.2.1
TEMPO_VERSION=2.7.2
LOKI_VERSION=3.4.3
OPENTELEMETRY_COLLECTOR_VERSION=0.123.0

POSTGRES_USER=app
POSTGRES_PASSWORD=app
POSTGRES_DB=app

OTEL_SERVICE_NAME="odoo-uv"
OTEL_TRACES_EXPORTER=otlp
# OTEL_TRACES_EXPORTER=console
OTEL_METRICS_EXPORTER=otlp
# OTEL_METRICS_EXPORTER=console
OTEL_LOGS_EXPORTER=otlp
# OTEL_LOGS_EXPORTER=console

OTEL_PYTHON_LOGGING_AUTO_INSTRUMENTATION_ENABLED=true
OTEL_PYTHON_LOG_FORMAT="%(msg)s [span_id=%(span_id)s]"
OTEL_PYTHON_LOG_LEVEL=debug
OTEL_PYTHON_LOG_CORRELATION=true

OTEL_EXPORTER_OTLP_ENDPOINT=http://0.0.0.0:4317
# GRPC_VERBOSITY=debug
# GRPC_TRACE=http,call_error,connectivity_state
There is nothing special here:
- we are instrumenting our application;
- providing explicit versions of otel backends;
- providing info about DB;
run it
I decided to skip odoo.conf file as at the end it was easier for me to just tinker with odoo-bin params. Just personal taste, nothing more.
1
docker compose up -d
Give it second or few to see that postgres is ready to accept connections:
1
2
3
4
5
6
7
8
9
10
❯ docker compose logs postgres
postgres-1  |
postgres-1  | PostgreSQL Database directory appears to contain a database; Skipping initialization
postgres-1  |
postgres-1  | 2025-04-13 09:36:07.693 UTC [1] LOG:  starting PostgreSQL 14.17 on x86_64-pc-linux-musl, compiled by gcc (Alpine 14.2.0) 14.2.0, 64-bit
postgres-1  | 2025-04-13 09:36:07.693 UTC [1] LOG:  listening on IPv4 address "0.0.0.0", port 5432
postgres-1  | 2025-04-13 09:36:07.693 UTC [1] LOG:  listening on IPv6 address "::", port 5432
postgres-1  | 2025-04-13 09:36:07.701 UTC [1] LOG:  listening on Unix socket "/var/run/postgresql/.s.PGSQL.5432"
postgres-1  | 2025-04-13 09:36:07.709 UTC [27] LOG:  database system was shut down at 2025-04-13 08:56:22 UTC
postgres-1  | 2025-04-13 09:36:07.729 UTC [1] LOG:  database system is ready to accept connections
Start odoo. Important thing here is: using opentelemetry-instrument
1
2
3
4
5
6
7
8
9
10
11
12
13
14
15
16
17
18
19
uv run \
 --env-file .env \
    -- \
    opentelemetry-instrument \
    python odoo-bin \
    --init=base,sale,stock \
    --load=base,sale,stock \
    --data-dir=./odoo-data \
    --addons-path=./odoo/addons \
    --database="$POSTGRES_DB" \
    --db_user="$POSTGRES_USER" \
    --db_password="$POSTGRES_PASSWORD" \
    --db_host=0.0.0.0 \
    --db_port=5432 \
    --db_sslmode=disable \
    --db_maxconn=10 \
    --max-cron-threads=1 \
    --workers=0 \
    --syslog
see traces in action
When service is running
1
2
❯ sudo grep "(werkzeug) running" /var/log/messages
Apr 13 11:37:59 fedora python[237813]: Odoo Server 18.0:?:INFO:odoo.service.server:HTTP service (werkzeug) running on fedora:8069
Navigate to localhost:8069 And simply login with admin/admin credentials.
There is new header attached to response:
X-Trace-Id
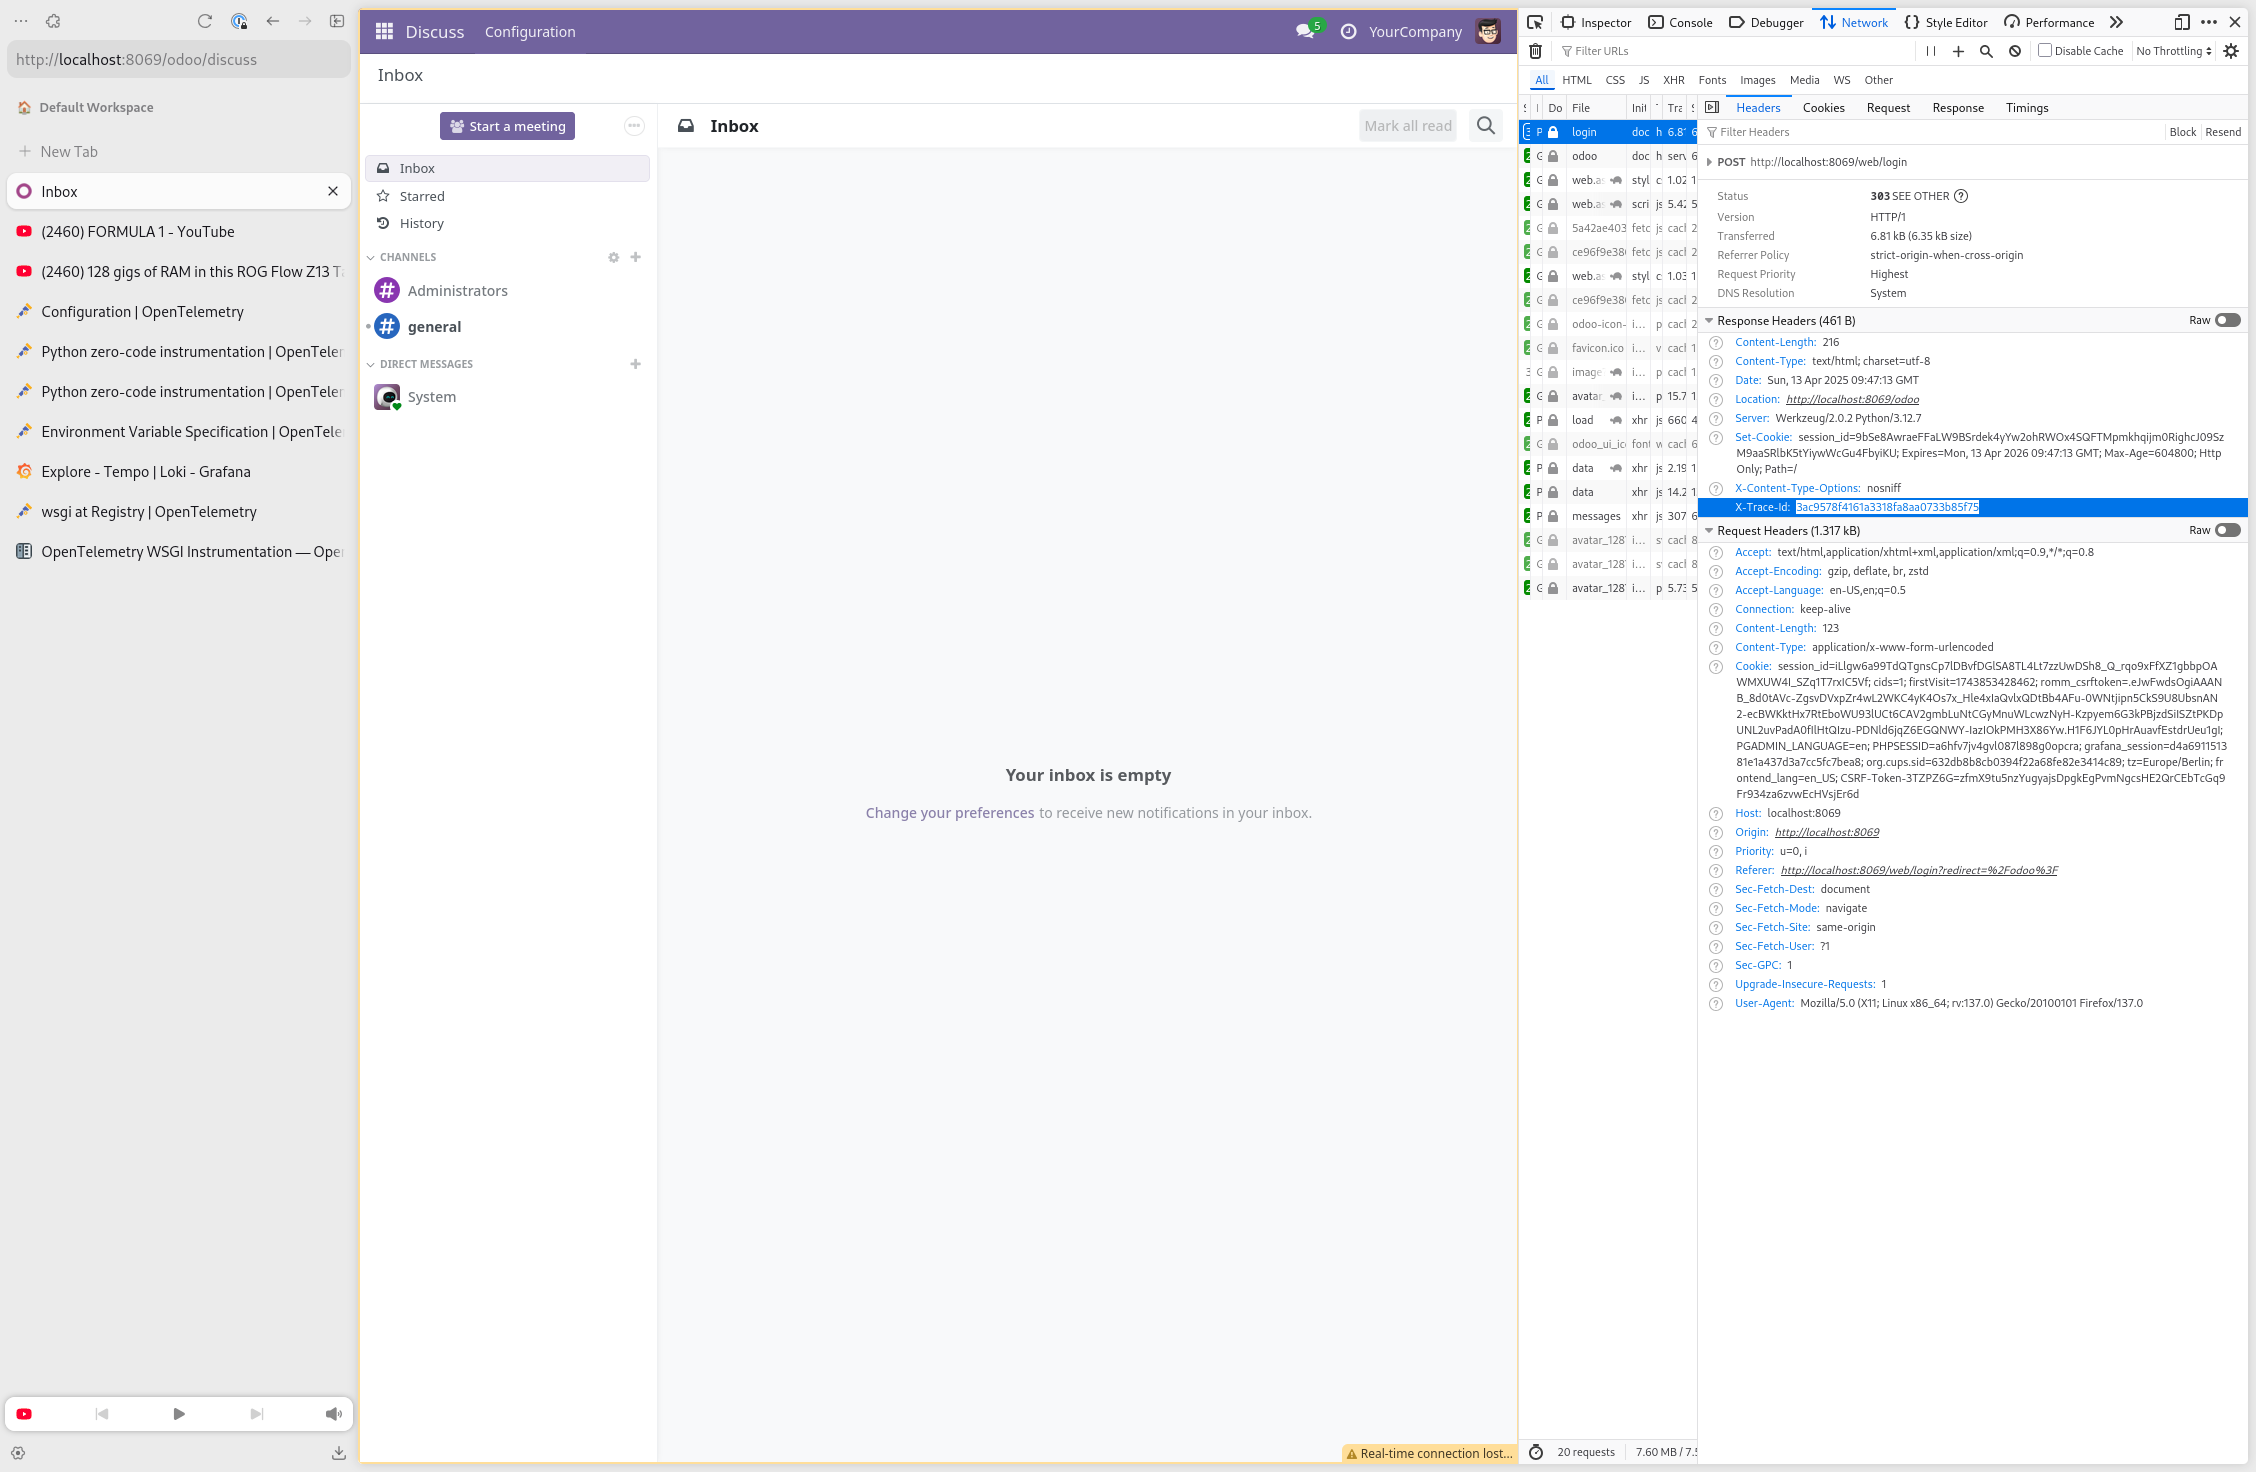
This is how to identify traces in brand new grafana instance.
Navigate to grafana > Explore / Tempo (as datasource)
And use previously selected trace id. (click “Run query” in top right corner)
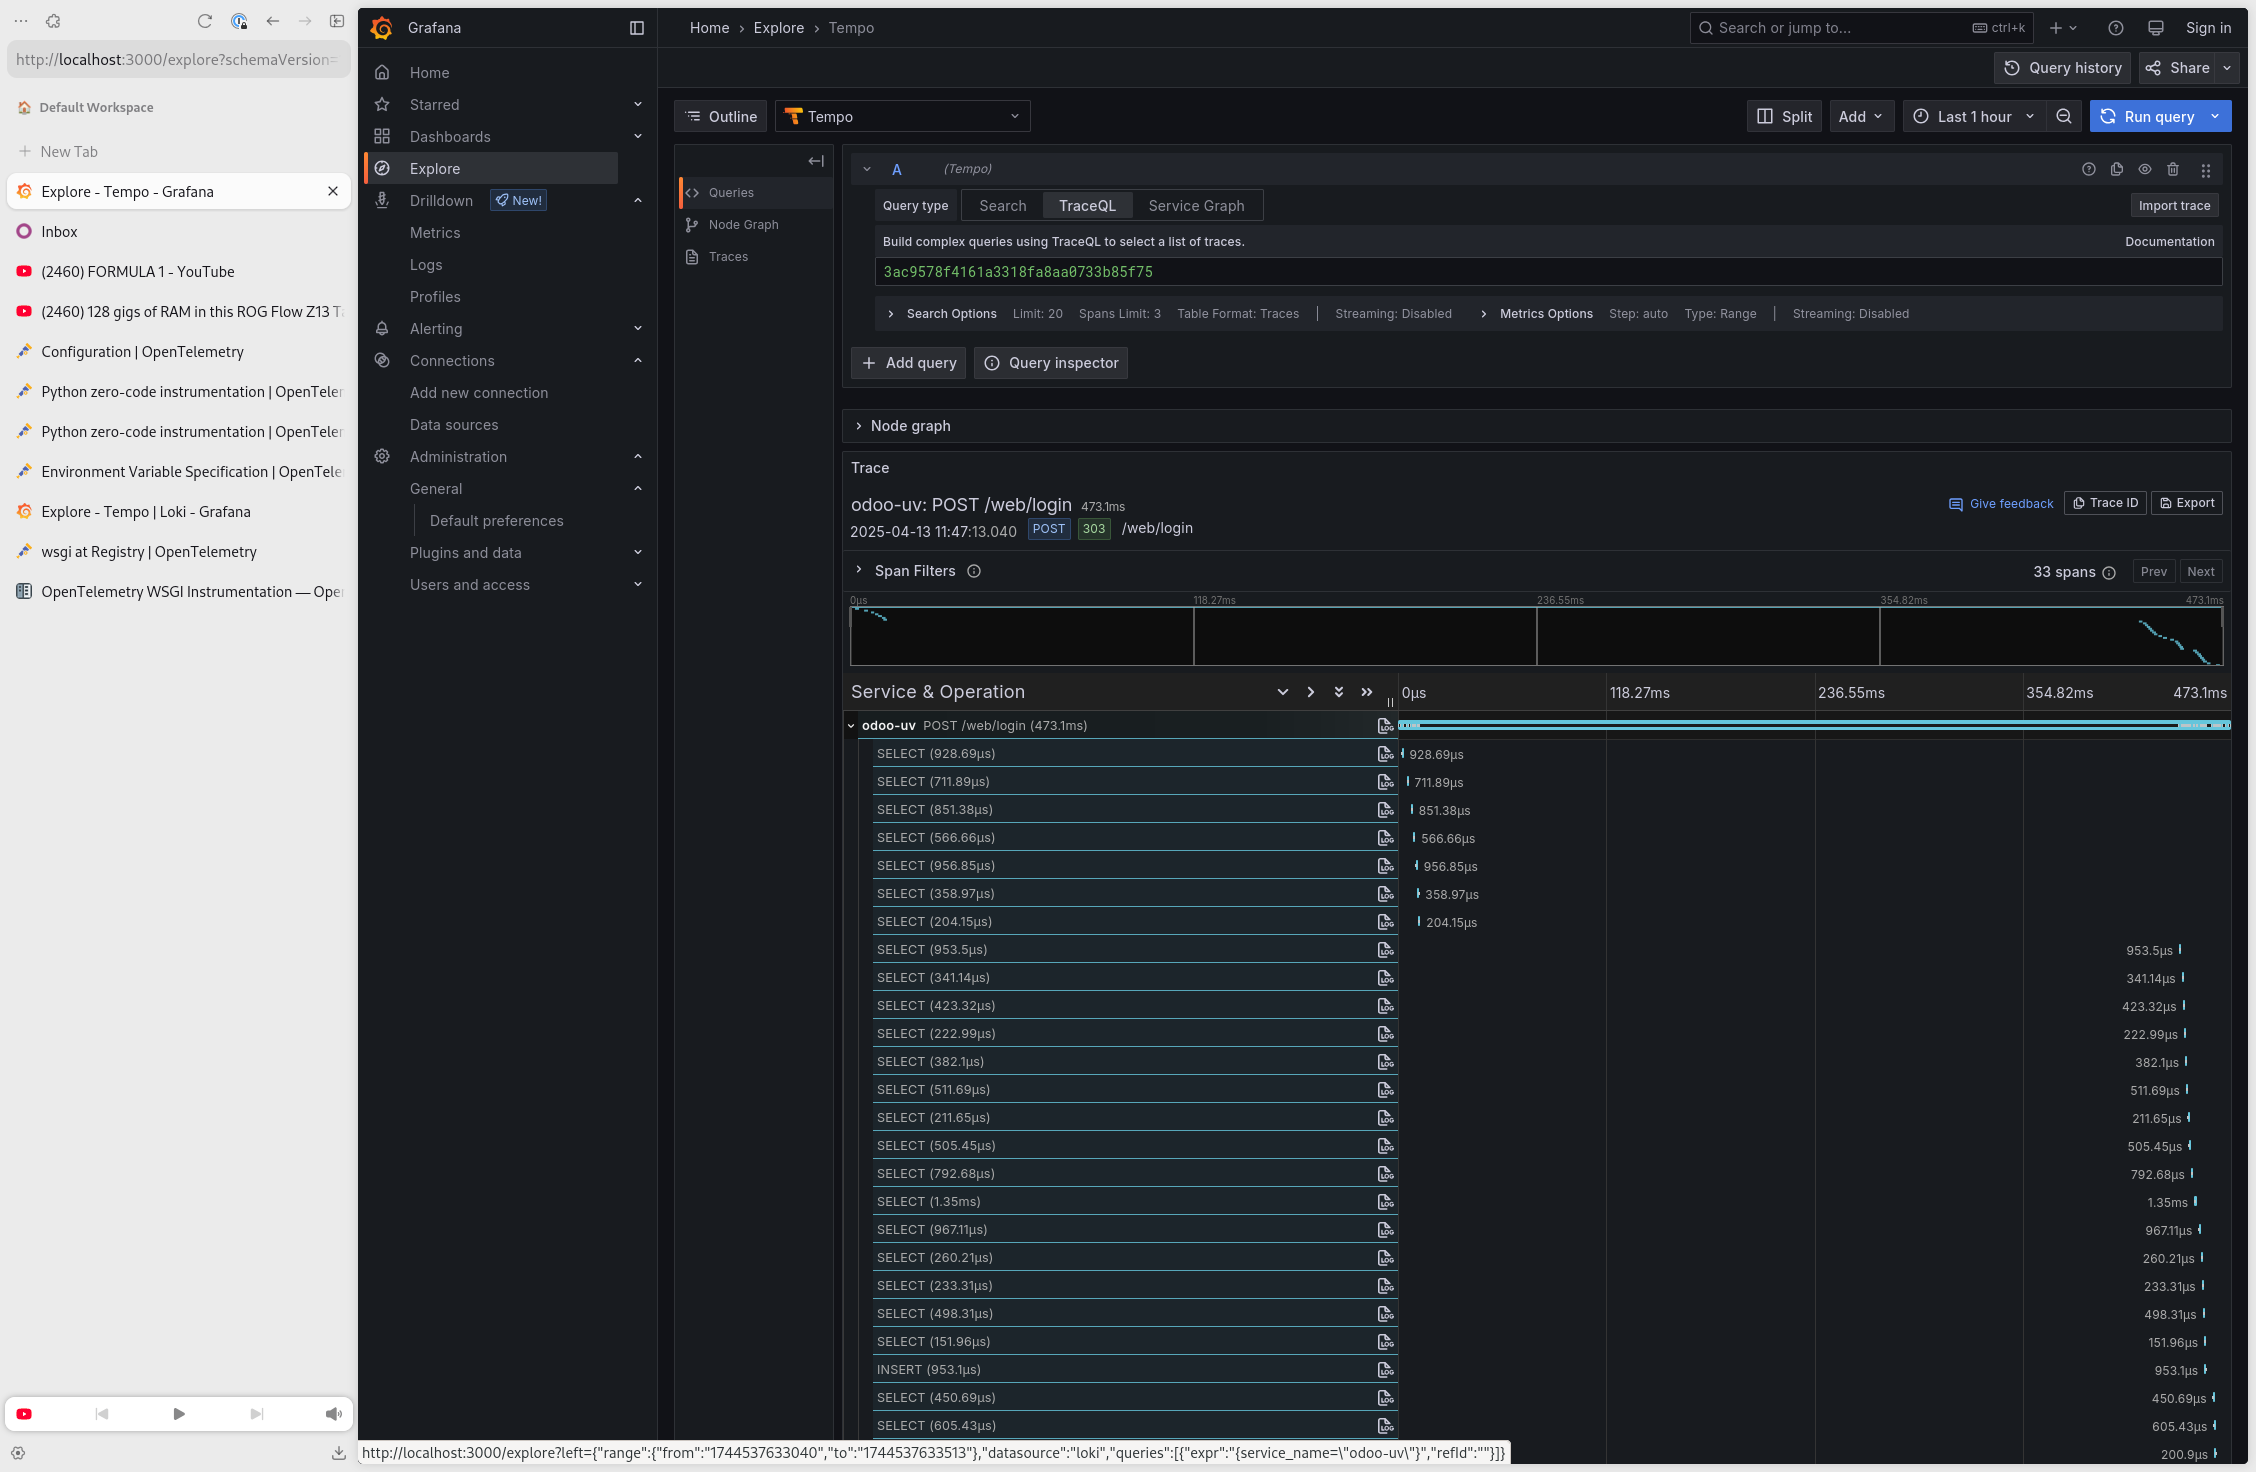
And there is beautiful waterfall of trace we are looking for and all the spans signaled under traceparent.
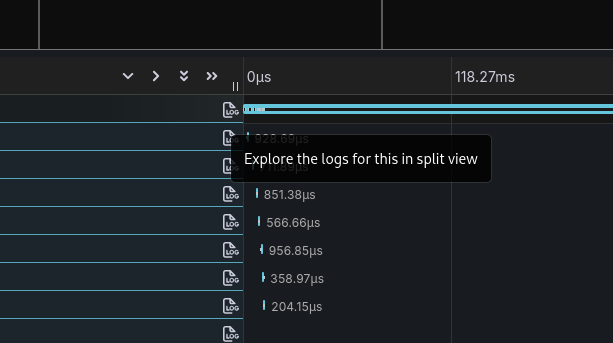
There is small log icon next to each trace/span to see LOGS that are correlated with highlighted entity.
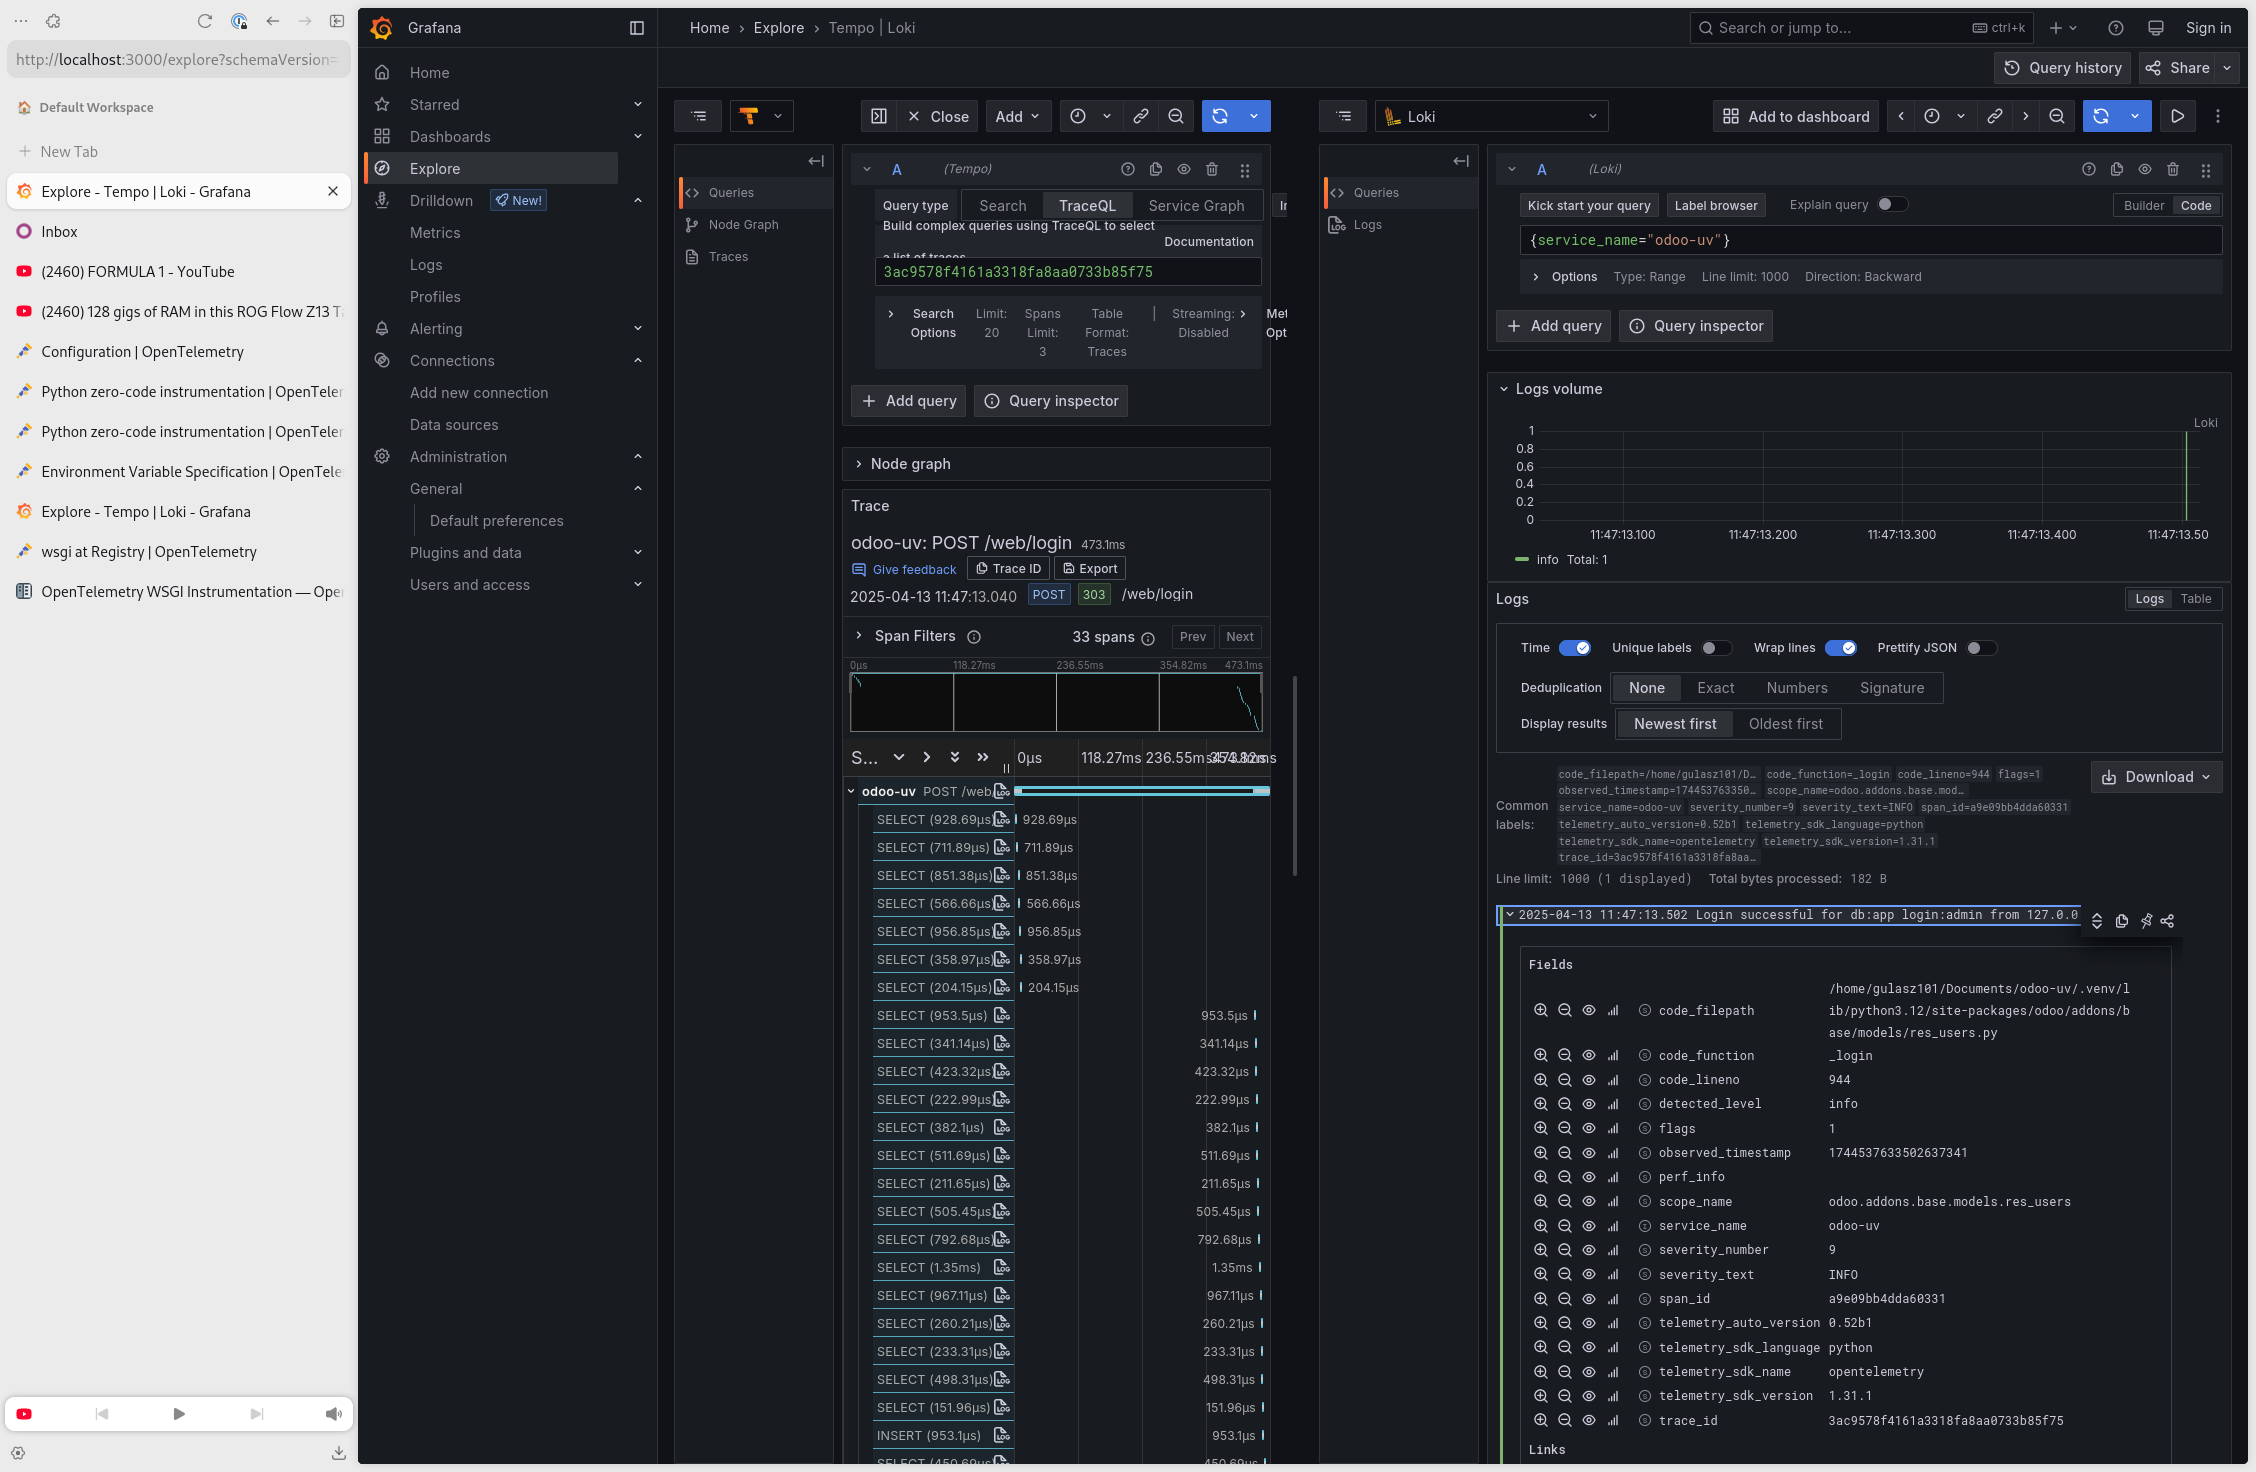
Here there are log details attached to highlighted trace.
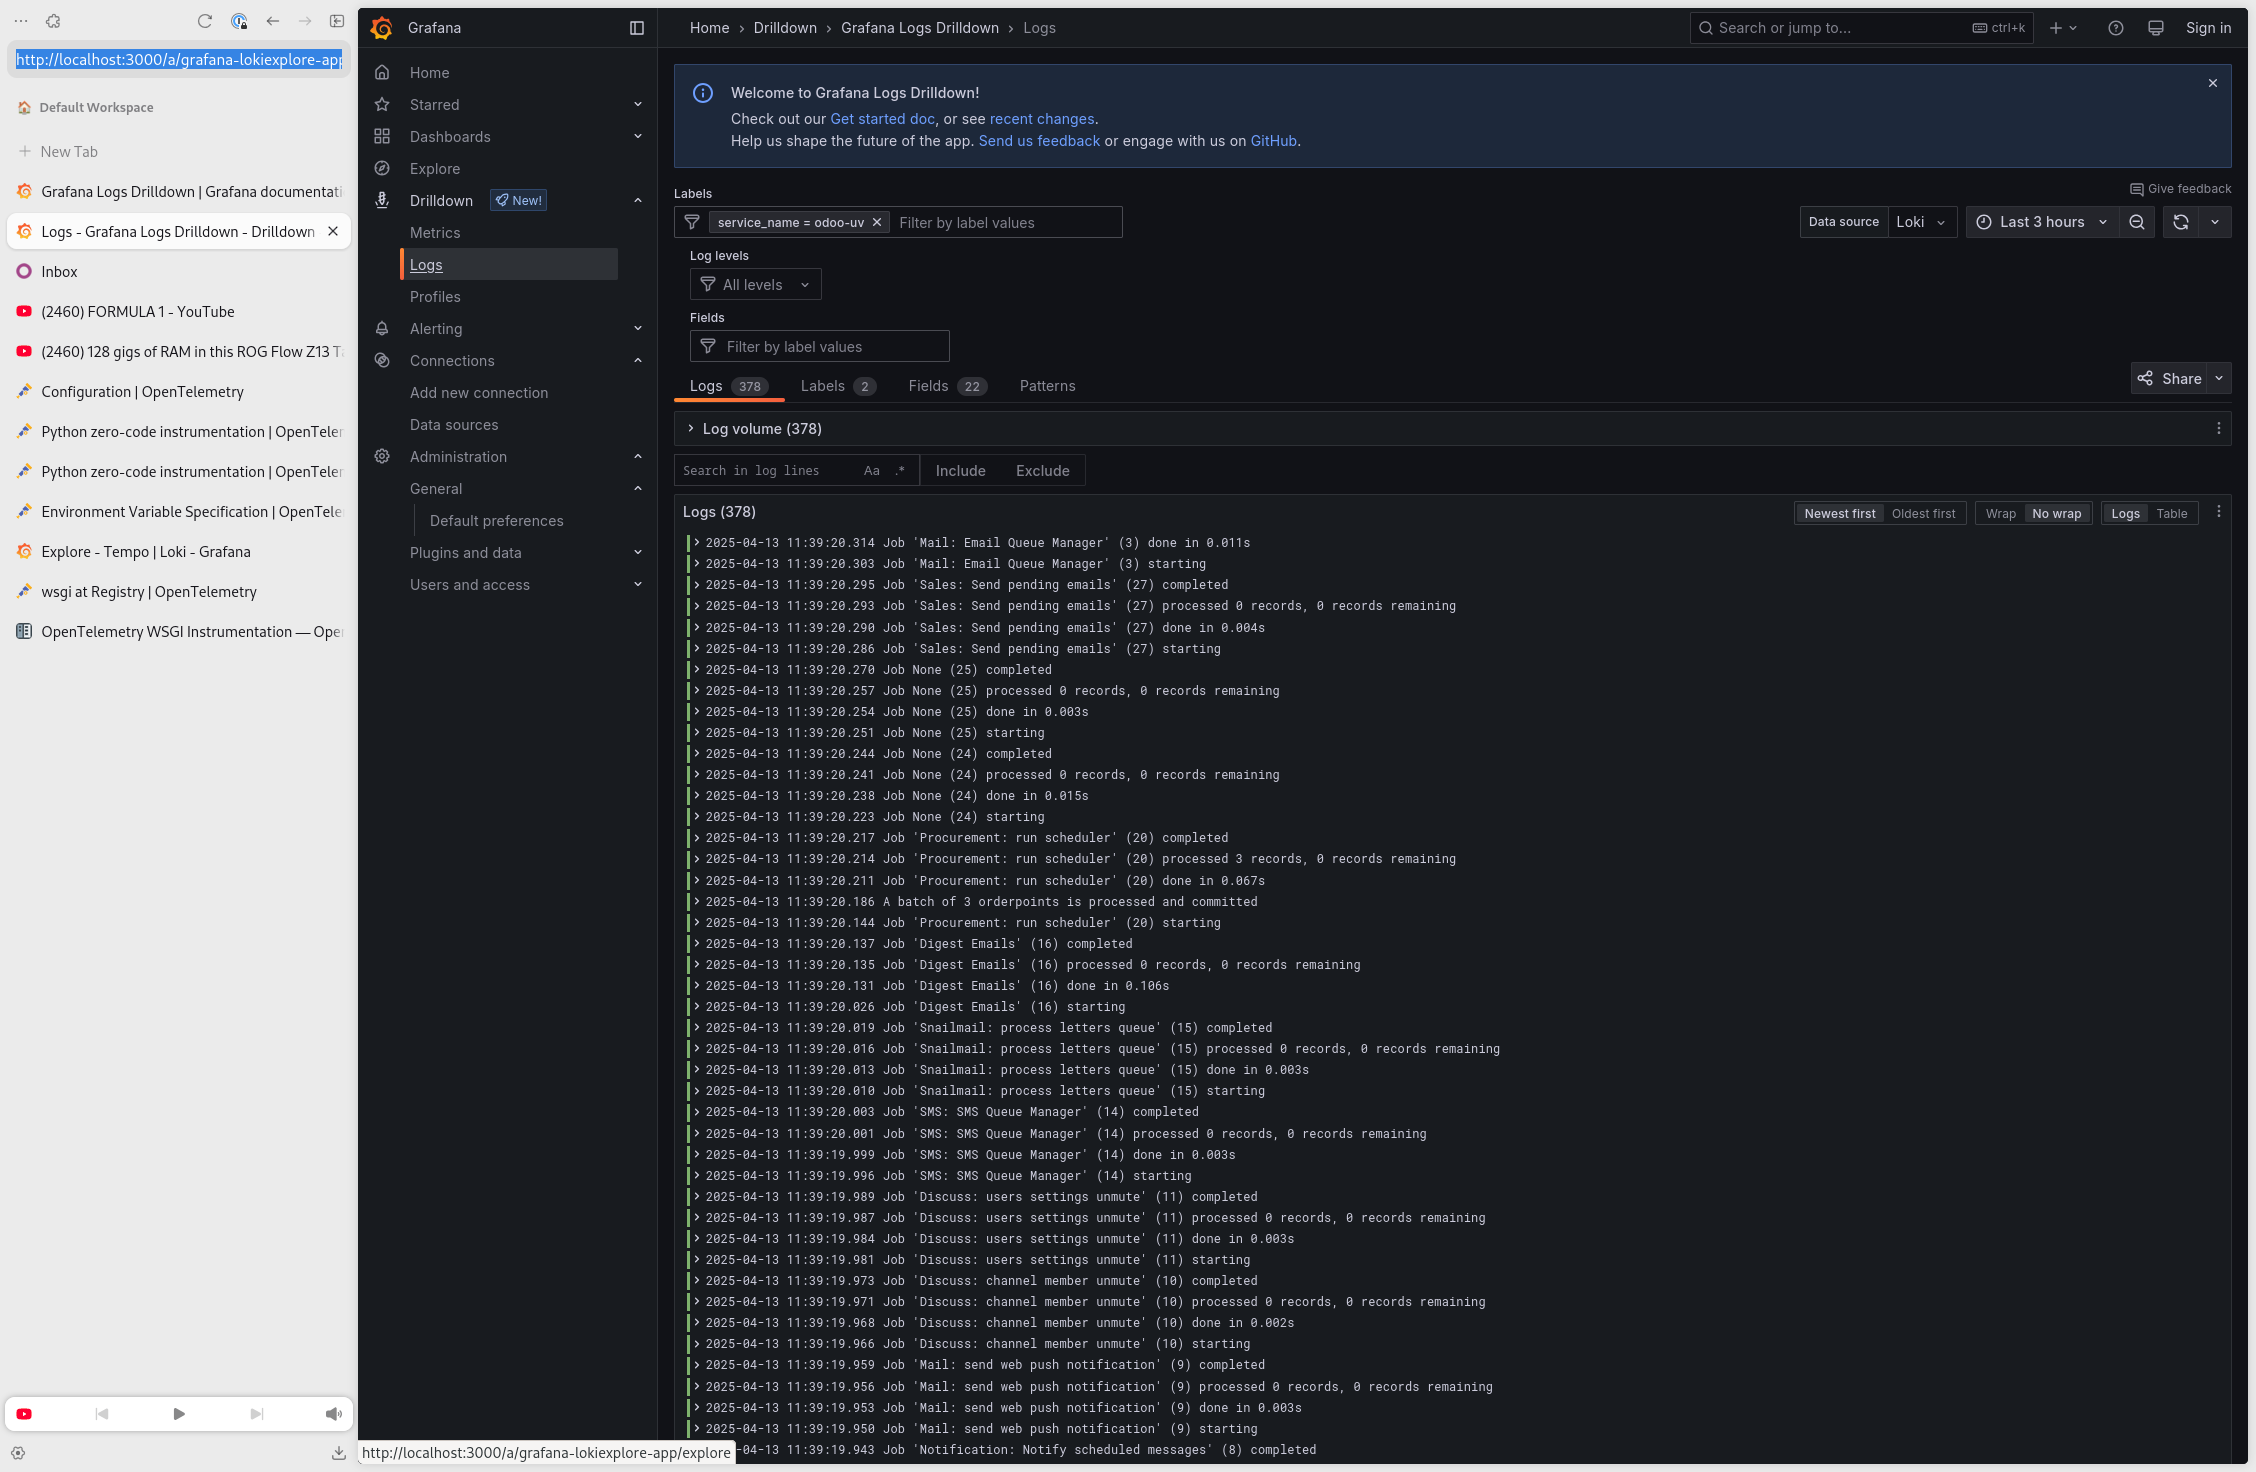
To explore logs, easiest way is just to jump into Drildown / Logs menu.
next steps
Manually exploring all the:
- logs
- traces
- metrics
is fun but it does not scale.
I’m going to write something about making proper visualization of all the signals soon(ish).
Till that time, I strongly recommend to jump into the RED method