OpenTelemetry Tracing Laravel Autoinstrumentation
opentelemetry rc1 released, have to say works really stable! Go for it and test :)
Laravel tracing autoinstrumentation using ext-opentelemetry
Below we will cover opentelemetry auto instrumentation by using barebones laravel served from docker container with roadrunner.
Roadrunner is going to start our root trace, and we will use laravel autoinstrumentation coming with open-telemetry/opentelemetry-auto-laravel package.
Traces will be send to Opentelemetry collector which will be forwarding everything to grafana tempo and finally we will be able to look through them exploring our local grafana instance.
Preparation
App runtime
We need to start from basic dockerfile for our application.
1
2
3
4
5
6
7
8
9
10
11
12
13
14
15
16
17
18
19
20
21
22
23
24
25
26
27
28
29
30
31
32
33
34
35
36
ARG PHP_VERSION=8.2

FROM ghcr.io/roadrunner-server/roadrunner:2.10.1 AS roadrunner
FROM composer:latest AS composer
FROM php:${PHP_VERSION}-alpine

WORKDIR /app

RUN addgroup -g "1000" -S php \
  && adduser --system --gecos "" --ingroup "php" --uid "1000" php \
  && mkdir /var/run/rr \
  && chown php /var/run/rr

COPY --from=mlocati/php-extension-installer /usr/bin/install-php-extensions /usr/local/bin/
RUN install-php-extensions \
    sockets \
    zip \
    grpc \
    mbstring \
    zlib \
    ffi \
    redis \
    protobuf \
    opentelemetry \
  pdo_pgsql


COPY --from=roadrunner /usr/bin/rr /usr/local/bin/rr
COPY --from=composer /usr/bin/composer /usr/bin/composer

RUN apk add --no-cache \
    bash \
    git \
    zlib

USER php
Next step is to build docker image based on it:
1
2
3
mkdir lara-otel-project
cd lara-otel-project
docker build --tag lara-otel .
Installing basic dependencies
So now we have to:
- install fresh instance of laravel;
- make it running with roadrunner thanks to laravel-bridge;
- introduce basic
docker-compose.ymlfile wrapping our local environment; - do the health check;
As following:
First step is easy
1
docker run -it --rm -v $PWD:/app lara-otel composer create-project laravel/laravel service
Now we need to do some basic setup of roadrunner
1
2
docker run -it --rm -v $PWD/service:/app lara-otel composer require spiral/roadrunner-laravel -W
docker run -it --rm -v $PWD/service:/app lara-otel php ./artisan vendor:publish --provider='Spiral\RoadRunnerLaravel\ServiceProvider' --tag=config
Very basic rr config file
1
2
3
4
5
6
7
8
9
10
11
12
13
14
15
16
17
18
19
20
version: "2.7"

server:
  command: "php ./vendor/bin/rr-worker start --relay-dsn unix:///var/run/rr/rr-relay.sock"
  relay: "unix:///var/run/rr/rr-relay.sock"


http:
  address: 0.0.0.0:8080
  middleware: ["static", "headers", "gzip"]
  pool:
    #max_jobs: 64 # feel free to change this
    supervisor:
      exec_ttl: 60s
  headers:
    response:
      X-Powered-By: "RoadRunner"
  static:
    dir: "public"
    forbid: [".php"]
Let’s test run this file:
1
docker run -it --rm -v $PWD/service:/app -v $PWD/rr-config.yaml:/app/.rr.yaml -p 8080:8080 lara-otel rr serve -c ./.rr.yaml
We should see something like:
1
2
3
4
5
6
7
8
9
10
11
❯ docker run -it --rm -v $PWD/service:/app -v $PWD/rr-config.yaml:/app/.rr.yaml -p 8080:8080 lara-otel rr serve -c ./.rr.yaml
[INFO] RoadRunner server started; version: 2.10.1, buildtime: 2022-05-19T10:34:00+0000
2023-05-29T19:43:24.321Z        DEBUG   server          worker is allocated     {"pid": 47, "internal_event_name": "EventWorkerConstruct"}
2023-05-29T19:43:24.345Z        DEBUG   server          worker is allocated     {"pid": 20, "internal_event_name": "EventWorkerConstruct"}
2023-05-29T19:43:24.353Z        DEBUG   server          worker is allocated     {"pid": 21, "internal_event_name": "EventWorkerConstruct"}
2023-05-29T19:43:24.361Z        DEBUG   server          worker is allocated     {"pid": 25, "internal_event_name": "EventWorkerConstruct"}
2023-05-29T19:43:24.363Z        DEBUG   server          worker is allocated     {"pid": 18, "internal_event_name": "EventWorkerConstruct"}
2023-05-29T19:43:24.364Z        DEBUG   server          worker is allocated     {"pid": 19, "internal_event_name": "EventWorkerConstruct"}
2023-05-29T19:43:24.387Z        DEBUG   server          worker is allocated     {"pid": 17, "internal_event_name": "EventWorkerConstruct"}
2023-05-29T19:43:24.387Z        DEBUG   server          worker is allocated     {"pid": 23, "internal_event_name": "EventWorkerConstruct"}
2023-05-29T19:43:24.387Z        DEBUG   http            http server was started {"address": "0.0.0.0:8080"}
And eventually we can test if app is alive:
1
2
3
4
5
6
7
8
9
10
11
12
13
14
15
16
17
18
19
20
21
22
23
~/Projects/otel-php-laravel
❯ curl -o /dev/null -s -w "%{http_code}\n" -v localhost:8080
*   Trying 127.0.0.1:8080...
* Connected to localhost (127.0.0.1) port 8080 (#0)
> GET / HTTP/1.1
> Host: localhost:8080
> User-Agent: curl/7.85.0
> Accept: */*
>
* Mark bundle as not supporting multiuse
< HTTP/1.1 200 OK
< Cache-Control: no-cache, private
< Content-Type: text/html; charset=UTF-8
< Date: Mon, 29 May 2023 19:46:47 GMT
< Set-Cookie: XSRF-TOKEN=[removed]; expires=Mon, 29 May 2023 21:46:47 GMT; Max-Age=7200; path=/; samesite=lax
< Set-Cookie: laravel_session=[removed]D; expires=Mon, 29 May 2023 21:46:47 GMT; Max-Age=7200; path=/; httponly; samesite=lax
< Vary: Accept-Encoding
< X-Powered-By: RoadRunner
< Transfer-Encoding: chunked
<
{ [27520 bytes data]
* Connection #0 to host localhost left intact
200
docker-compose file
We will go super basic: we will setup basic postgres so we will have some database connection info trace and app service based on already built image to run our application and that is all we need to perform health check and continue to actual tracing.
1
2
3
4
5
6
7
8
9
10
11
12
13
14
15
16
17
18
19
20
21
22
23
24
25
26
27
28
29
30
31
32
33
34
35
36
37
38
39
40
41
42
43
44
45
46
47
48
49
50
51
52
53
54
55
56
57
58
59
60
61
62
version: "3.6"

services:
  app:
    build:
      context: .
      dockerfile: Dockerfile
    command: rr serve -c /app/.rr.yaml
    ports:
      - "8080:8080"
    volumes:
      - "./service:/app"
      - "./rr-config.yaml:/app/.rr.yaml"
    environment:
      APP_ENV: local
      APP_NAME: lara-otel-service
      APP_KEY: base64:1SHk1sdZNFYb9V/2QLcDkcZIwwfn2bmJoaTotOXmmT8=
      APP_DEBUG: true
      APP_URL: http://localhost
      DB_CONNECTION: pgsql
      DB_HOST: postgres
      DB_PORT: 5432
      DB_DATABASE: laravel
      DB_USERNAME: postgres
      DB_PASSWORD: foobar
      BROADCAST_DRIVER: log
      CACHE_DRIVER: file
      FILESYSTEM_DISK: local
      QUEUE_CONNECTION: sync
      SESSION_DRIVER: file
      SESSION_LIFETIME: 120

  postgres:
    image: postgres
    restart: always
    volumes:
      - pgdata:/var/lib/postgresql/data
    environment:
      POSTGRES_USER: postgres
      POSTGRES_PASSWORD: foobar
      POSTGRES_DB: laravel
  dbgate:
    image: dbgate/dbgate
    restart: always
    ports:
      - 3001:3000
    volumes:
      - dbgdata:/root/.dbgate
    environment:
      CONNECTIONS: LARAVEL

      LABEL_LARAVEL: lara_postgres
      SERVER_LARAVEL: postgres
      USER_LARAVEL: postgres
      PASSWORD_LARAVEL: foobar
      PORT_LARAVEL: 5432
      ENGINE_LARAVEL: postgres@dbgate-plugin-postgres

volumes:
  pgdata:
  dbgdata:
Finally we can install some healthcheck
so our application by just checking its health will have enough to do to provide us meaningful traces.
Assuming you application is up and running (docker compose up -d) please install following dependency:
1
2
3
4
5
6
docker compose exec app composer require spatie/laravel-health

# execute following commands for basic setup:
docker compose exec app php artisan vendor:publish --tag="health-config"
docker compose exec app php artisan vendor:publish --tag="health-migrations"
docker compose exec app php artisan migrate
To make our application busy we will register some health checks in respective service provider, so it should look as following:
1
2
3
4
5
6
7
8
9
10
11
12
13
14
15
16
17
18
19
20
21
22
23
24
25
26
27
28
29
30
31
32
33
34
35
36
37
<?php

namespace App\Providers;

use Illuminate\Support\ServiceProvider;
use Spatie\Health\Checks\Checks\DatabaseCheck;
use Spatie\Health\Checks\Checks\EnvironmentCheck;
use Spatie\Health\Checks\Checks\PingCheck;
use Spatie\Health\Checks\Checks\RedisCheck;
use Spatie\Health\Checks\Checks\UsedDiskSpaceCheck;
use Spatie\Health\Facades\Health;

class HealthServiceProvider extends ServiceProvider
{
    /**
     * Register services.
     */
    public function register(): void
    {
        //
    }

    /**
     * Bootstrap services.
     */
    public function boot(): void
    {
        Health::checks([
            DatabaseCheck::new(),
            EnvironmentCheck::new(),
            PingCheck::new()->url('https://example.com')->timeout(2),
            RedisCheck::new(),
            UsedDiskSpaceCheck::new(),
        ]);
    }
}
Now after running health check against local instance we should see output as following:
1
2
3
4
5
6
7
8
9
10
11
12
13
❯ docker compose exec app php artisan health:list


    Laravel Health Check Results                                                      Last ran all the checks just now


  OK         Database › Ok
  FAILED     Environment › local
             ⇂ The environment was expected to be `production`, but actually was `local`
  OK         Ping › Reachable
  FAILED     Redis › Failed
             ⇂ An exception occurred when connecting to Redis: `Connection refused`
  OK         Used Disk Space › 11%
Opentelemetry collector
Finally! After all this boilerplate preparation we can start setting up actual subject of this article.
As mentioned before we need:
- Something to collect data -> opentelemetry collector;
- Something to persist data -> grafana tempo;
- Something to display our traces -> grafana itself;
Configuring collector
Here we will perform basic configuration of our collector, which will display all the traces in logs feed (docker compose logs collector -f). We have to also instrument our laravel application to dispatch traces over gRPC to collector.
Basic configuration file
We will first start from otel-collector-config.yml file placed next to docker-compose.yml. For now we are instrumenting collector to output all traces as log.
1
2
3
4
5
6
7
8
9
10
11
12
13
14
15
16
17
18
19
20
receivers:
  otlp:
    protocols:
      grpc:
      http:

processors:
  batch:

exporters:
  logging:
    loglevel: debug

service:
  pipelines:
    traces:
      receivers: [otlp]
      processors: [batch]
      exporters: [logging]
New service in docker-compose.yml
1
2
3
4
5
6
  collector:
    image: otel/opentelemetry-collector-contrib
    command: ["--config=/etc/otel-collector-config.yml"]
    volumes:
      - ./otel-collector-config.yml:/etc/otel-collector-config.yml
Instrumenting laravel app
First we need to let our app to install dependencies with beta stability:
1
2
    "minimum-stability": "beta",
    "prefer-stable": true,
Next we are installing required dependencies:
1
docker compose exec app composer require open-telemetry/transport-grpc:1.0.0RC1 open-telemetry/exporter-otlp:1.0.0RC1 open-telemetry/opentelemetry-auto-laravel
Next we have to feed app service with proper environment:
1
2
3
4
5
6
7
8
9
services:
  app:
    environment:
      OTEL_PHP_AUTOLOAD_ENABLED: true
      OTEL_SERVICE_NAME: app-otel-service
      OTEL_TRACES_EXPORTER: otlp
      OTEL_TRACES_PROCESSOR: batch
      OTEL_EXPORTER_OTLP_PROTOCOL: grpc
      OTEL_EXPORTER_OTLP_ENDPOINT: 'http://collector:4317'
After performing multiple times (we are using batch processor, so only if we will have enough cached traces will be send) request to our health check endpoint we:
1
curl -vvv localhost:8080/health?fresh -H "Accept: application/json"
Our collector should output something like:
1
2
3
4
5
6
7
8
9
10
11
12
13
14
15
16
17
otel-php-laravel-collector-1  | Span #28
otel-php-laravel-collector-1  |     Trace ID       : cd8b44caebd1ab028ca4a115e169483e
otel-php-laravel-collector-1  |     Parent ID      : 80b04f5c21ea58e7
otel-php-laravel-collector-1  |     ID             : 51af7a2af2cbb9f4
otel-php-laravel-collector-1  |     Name           : sql INSERT
otel-php-laravel-collector-1  |     Kind           : Client
otel-php-laravel-collector-1  |     Start time     : 2023-05-30 19:16:17.285477888 +0000 UTC
otel-php-laravel-collector-1  |     End time       : 2023-05-30 19:16:17.289327891 +0000 UTC
otel-php-laravel-collector-1  |     Status code    : Unset
otel-php-laravel-collector-1  |     Status message :
otel-php-laravel-collector-1  | Attributes:
otel-php-laravel-collector-1  |      -> db.system: Str(pgsql)
otel-php-laravel-collector-1  |      -> db.name: Str(laravel)
otel-php-laravel-collector-1  |      -> db.operation: Str(INSERT)
otel-php-laravel-collector-1  |      -> db.user: Str(postgres)
otel-php-laravel-collector-1  |      -> db.statement: Str(insert into "health_check_result_history_items" ("check_name", "check_label",
 "ended_at", "updated_at", "created_at") values (?, ?, ?, ?, ?, ?, ?, ?, ?, ?) returning "id")
!! BOOM !! Our application is instrumented to dispatch opentelemetry traces over grpc to collector.
Human readable traces with tempo and grafana
So reading logs proving we have instrumented our application correct, but this is far from ideal solution.
Let’s visualize them!
Setup
To do so, we need two more components, tempo as storage of traces for grafana, and grafana itself so we can display everything in easy to digest form, search over them, maybe made some dashboards.
New services in docker-compose.yml
1
2
3
4
5
6
7
8
9
10
11
12
13
14
15
16
17
18
19
20
21
22
23
24
25
services:
  tempo:
    image: grafana/tempo:latest
    command: [ "-config.file=/etc/tempo.yaml" ]
    volumes:
      - ./tempo-config.yaml:/etc/tempo.yaml
      - ./tempodata:/tmp/tempo
    ports:
      - "3200"   # tempo
      - "4317"  # otlp grpc
      - "4318"  # otlp http
  grafana:
    image: grafana/grafana:9.3.2
    volumes:
      - ./grafana-datasources-config.yaml:/etc/grafana/provisioning/datasources/datasources.yaml
    environment:
      - GF_AUTH_ANONYMOUS_ENABLED=true
      - GF_AUTH_ANONYMOUS_ORG_ROLE=Admin
      - GF_AUTH_DISABLE_LOGIN_FORM=true
      - GF_FEATURE_TOGGLES_ENABLE=traceqlEditor
    ports:
      - "3000:3000"

volumes:
  tempodata:
tempo-config.yaml (next to docker-compose.yml file)
1
2
3
4
5
6
7
8
9
10
11
12
13
14
15
16
17
18
19
20
21
22
23
24
25
server:
  http_listen_port: 3200

distributor:
  receivers:                           # this configuration will listen on all ports and protocols that tempo is capable of.
    otlp:
      protocols:
        http:
        grpc:
    opencensus:

ingester:
  max_block_duration: 5m               # cut the headblock when this much time passes. this is being set for demo purposes and should probably be left alone normally

compactor:
  compaction:
    block_retention: 1h                # overall Tempo trace retention. set for demo purposes

storage:
  trace:
    backend: local                     # backend configuration to use
    wal:
      path: /tmp/tempo/wal             # where to store the the wal locally
    local:
      path: /tmp/tempo/blocks
garafana-datasources-config.yaml (next to docker-compose.yml file)
1
2
3
4
5
6
7
8
9
10
11
12
13
14
apiVersion: 1

datasources:
- name: Tempo
  type: tempo
  access: proxy
  orgId: 1
  url: http://tempo:3200
  basicAuth: false
  isDefault: true
  version: 1
  editable: true
  apiVersion: 1
  uid: tempo
So above we just setup single data source called “Tempo” pointing at service “tempo” so later in grafana under Explore tab we can look for our traces.
Persisting traces in tempo
Now we have to instrument our collector to forward all traces to tempo instead outputting them as logs.
What we have to do is to add another exporter to our config, this will be exporter pointing at grpc port of tempo tempo:4317.
Our config has to look as following:
1
2
3
4
5
6
7
8
9
10
11
12
13
14
15
16
17
18
19
20
21
22
23
receivers:
  otlp:
    protocols:
      grpc:
      http:

processors:
  batch:

exporters:
  logging:
    loglevel: debug
  otlp/tempo:
    endpoint: tempo:4317
    tls:
      insecure: true

service:
  pipelines:
    traces:
      receivers: [otlp]
      processors: [batch]
      exporters: [otlp/tempo, logging]
It is time to restart our local stack:
1
docker compose restart
Now after performing multiple requests to our health check endpoint:
1
curl -vvv localhost:8080/health?fresh -H "Accept: application/json"
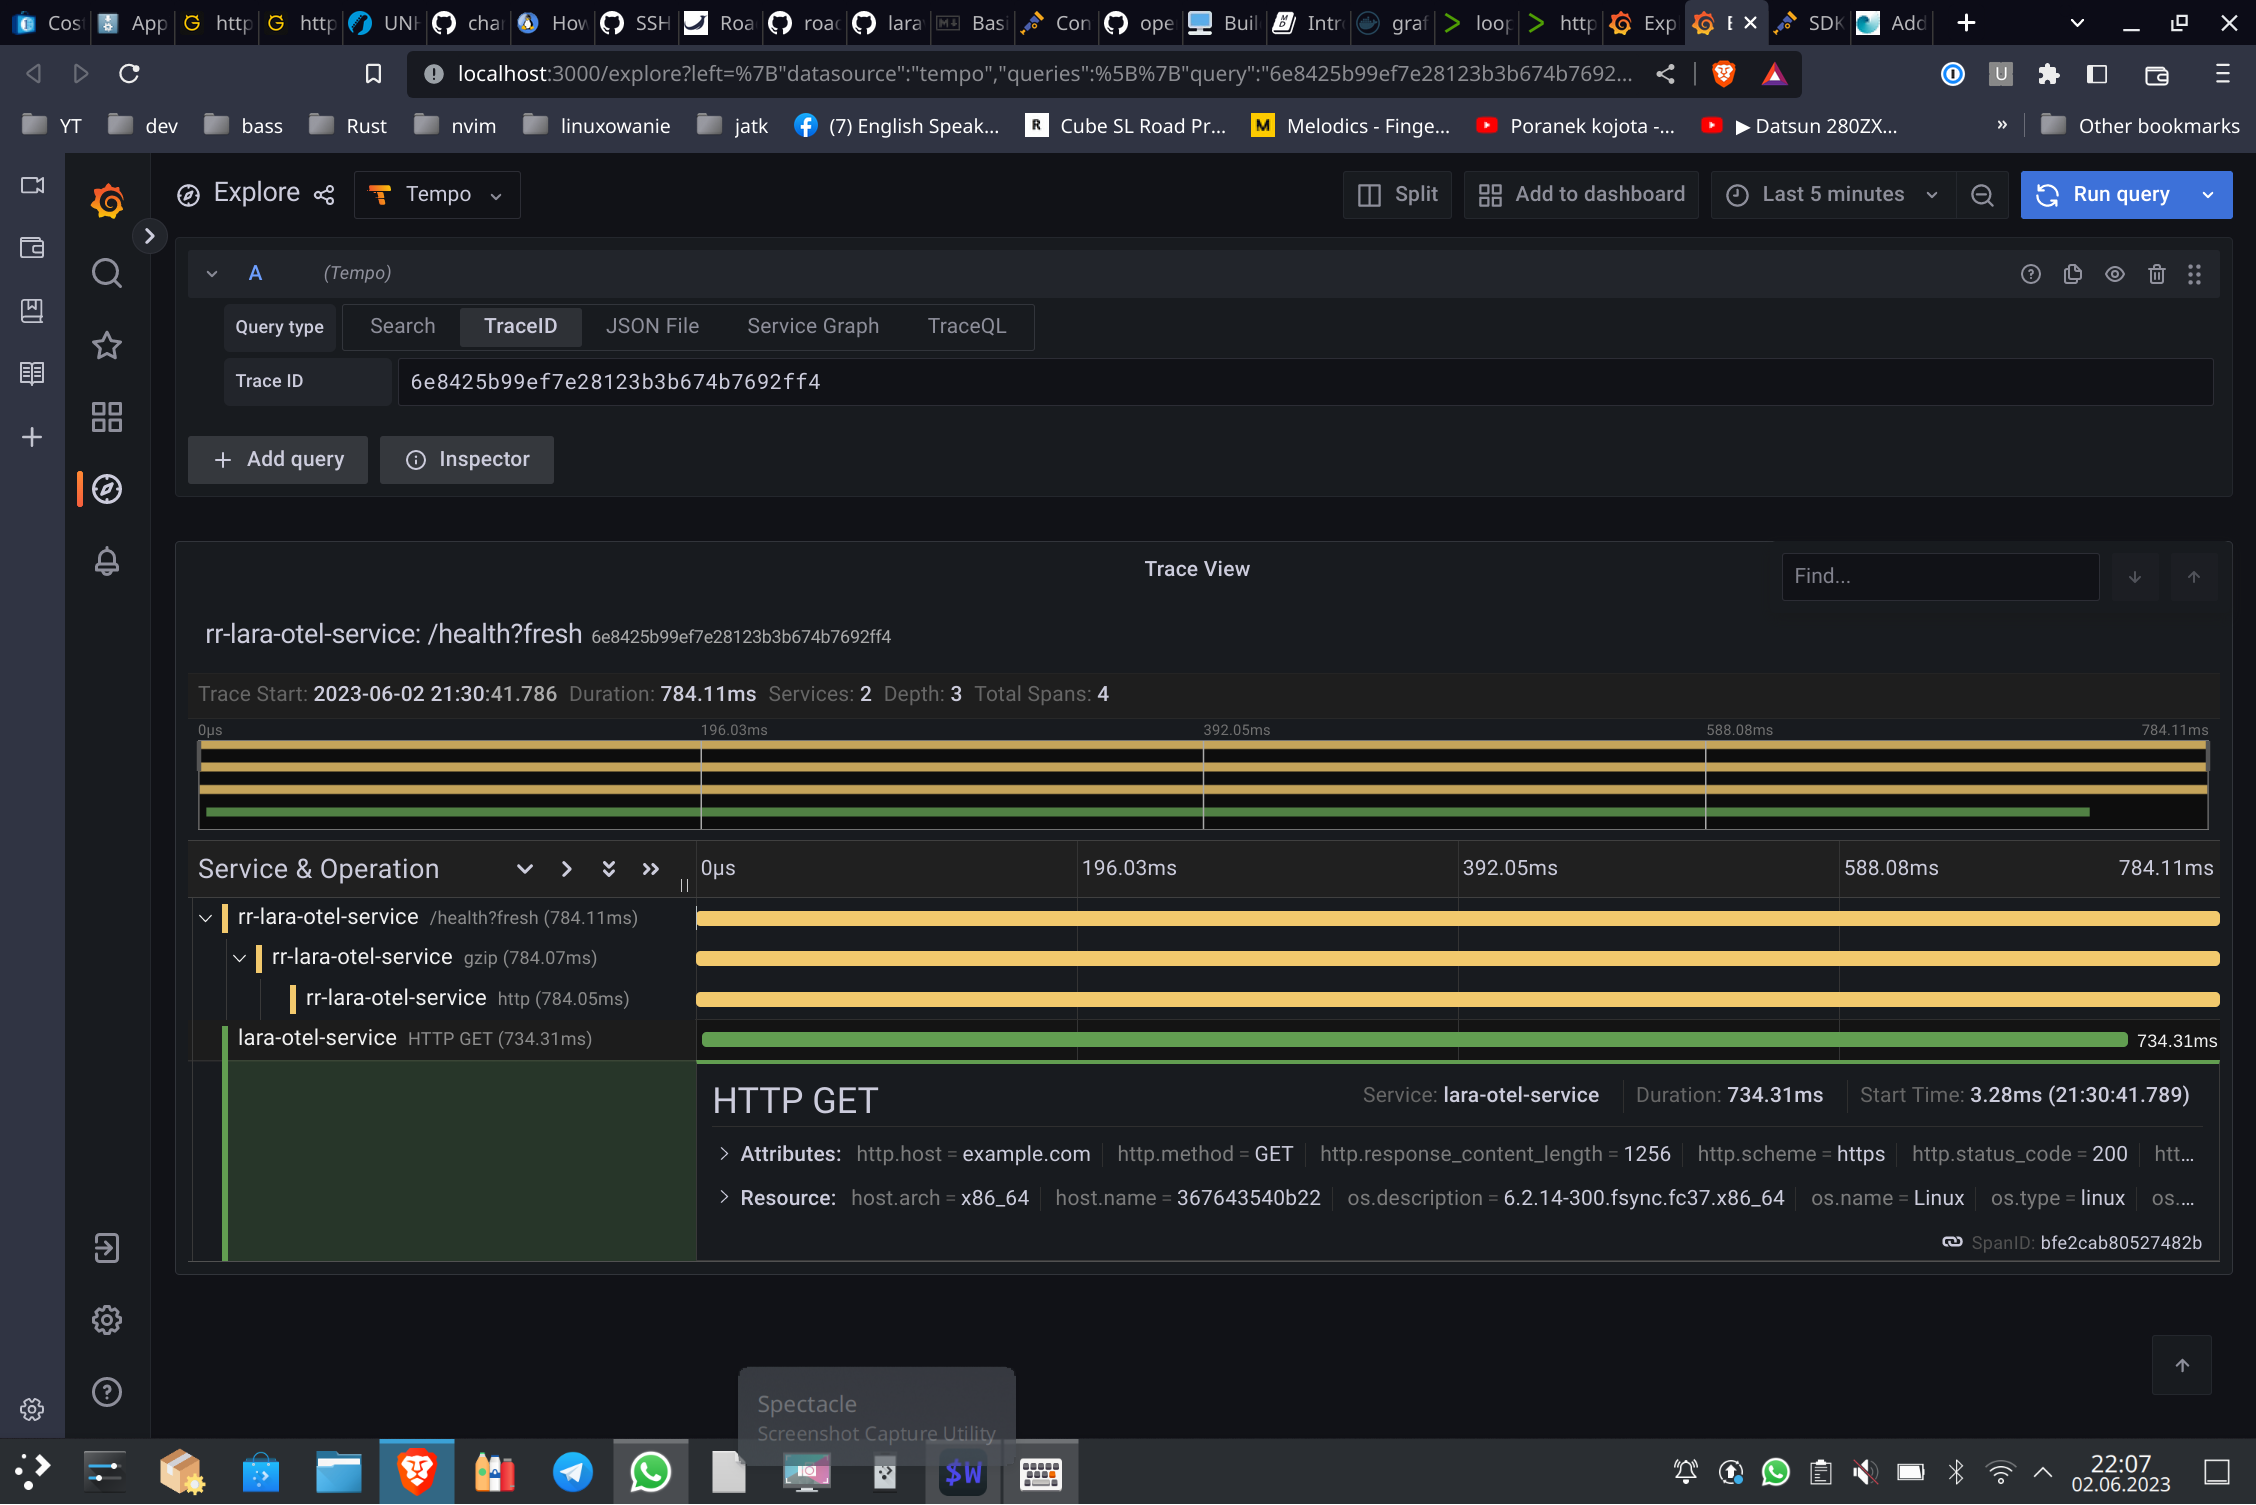
We can navigate to local grafana and go directly to tab: Explore
We should see result as following, with which we can play around.

Instrumenting roadrunner to create parent traces
So overall, roadrunner has builtin middleware we can configure to decorating our incoming requests into parent traces.
We just need to enable it, so final rr configuration should look as following:
1
2
3
4
5
6
7
8
9
10
11
12
13
14
15
16
17
18
19
20
21
22
23
24
25
26
27
28
version: "2.7"

server:
  command: "php ./vendor/bin/rr-worker start --relay-dsn unix:///var/run/rr/rr-relay.sock"
  relay: "unix:///var/run/rr/rr-relay.sock"


http:
  address: 0.0.0.0:8080
  middleware: ["static", "headers", "gzip", "otel"]
  pool:
    #max_jobs: 64 # feel free to change this
    supervisor:
      exec_ttl: 60s
  headers:
    response:
      X-Powered-By: "RoadRunner"
  static:
    dir: "public"
    forbid: [".php"]
  otel:
    insecure: true
    compress: false
    client: http
    exporter: otlp
    service_name: rr-${OTEL_SERVICE_NAME} # your app name
    service_version: 1.0.0 # your app version
    endpoint: collector:4318
And here we are, RoadRunner starts spans and everything generated by laravel autoinstrumentation is in single place.
Summary
Overall using opentelemetry extension is very convenient way of tracing / profiling our application.
Basically installing few dependencies and setting up few environment variables and without coding can autoinstrument our application to start propagating traces. We can send them to any opentelemetry compatible collector / storage.
Very important note:
opentelemetry for PHP is unstable -> as for date of writing this note we have to be aware that in any moment can cause “segmentation fault” and our app is dead. Personally during stress testing I noticed that when we do have more exceptions or generally bigger spans are more likely to cause issue. Overall future is bright and super interesting.
Just if someone needs working example combining all the config files from above, here is a repo to checkout.
Just:
- clone it
docker compose up -ddocker compose exec app composer installdocker compose exec app php artisan migrate- play around with grafana